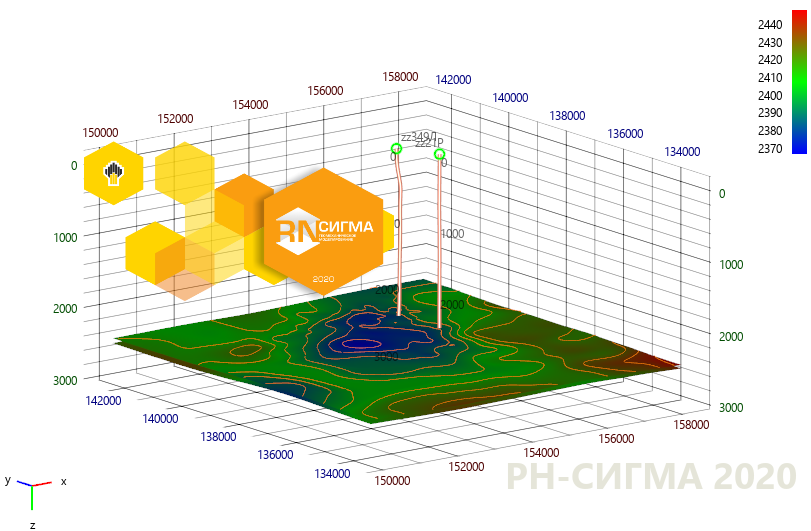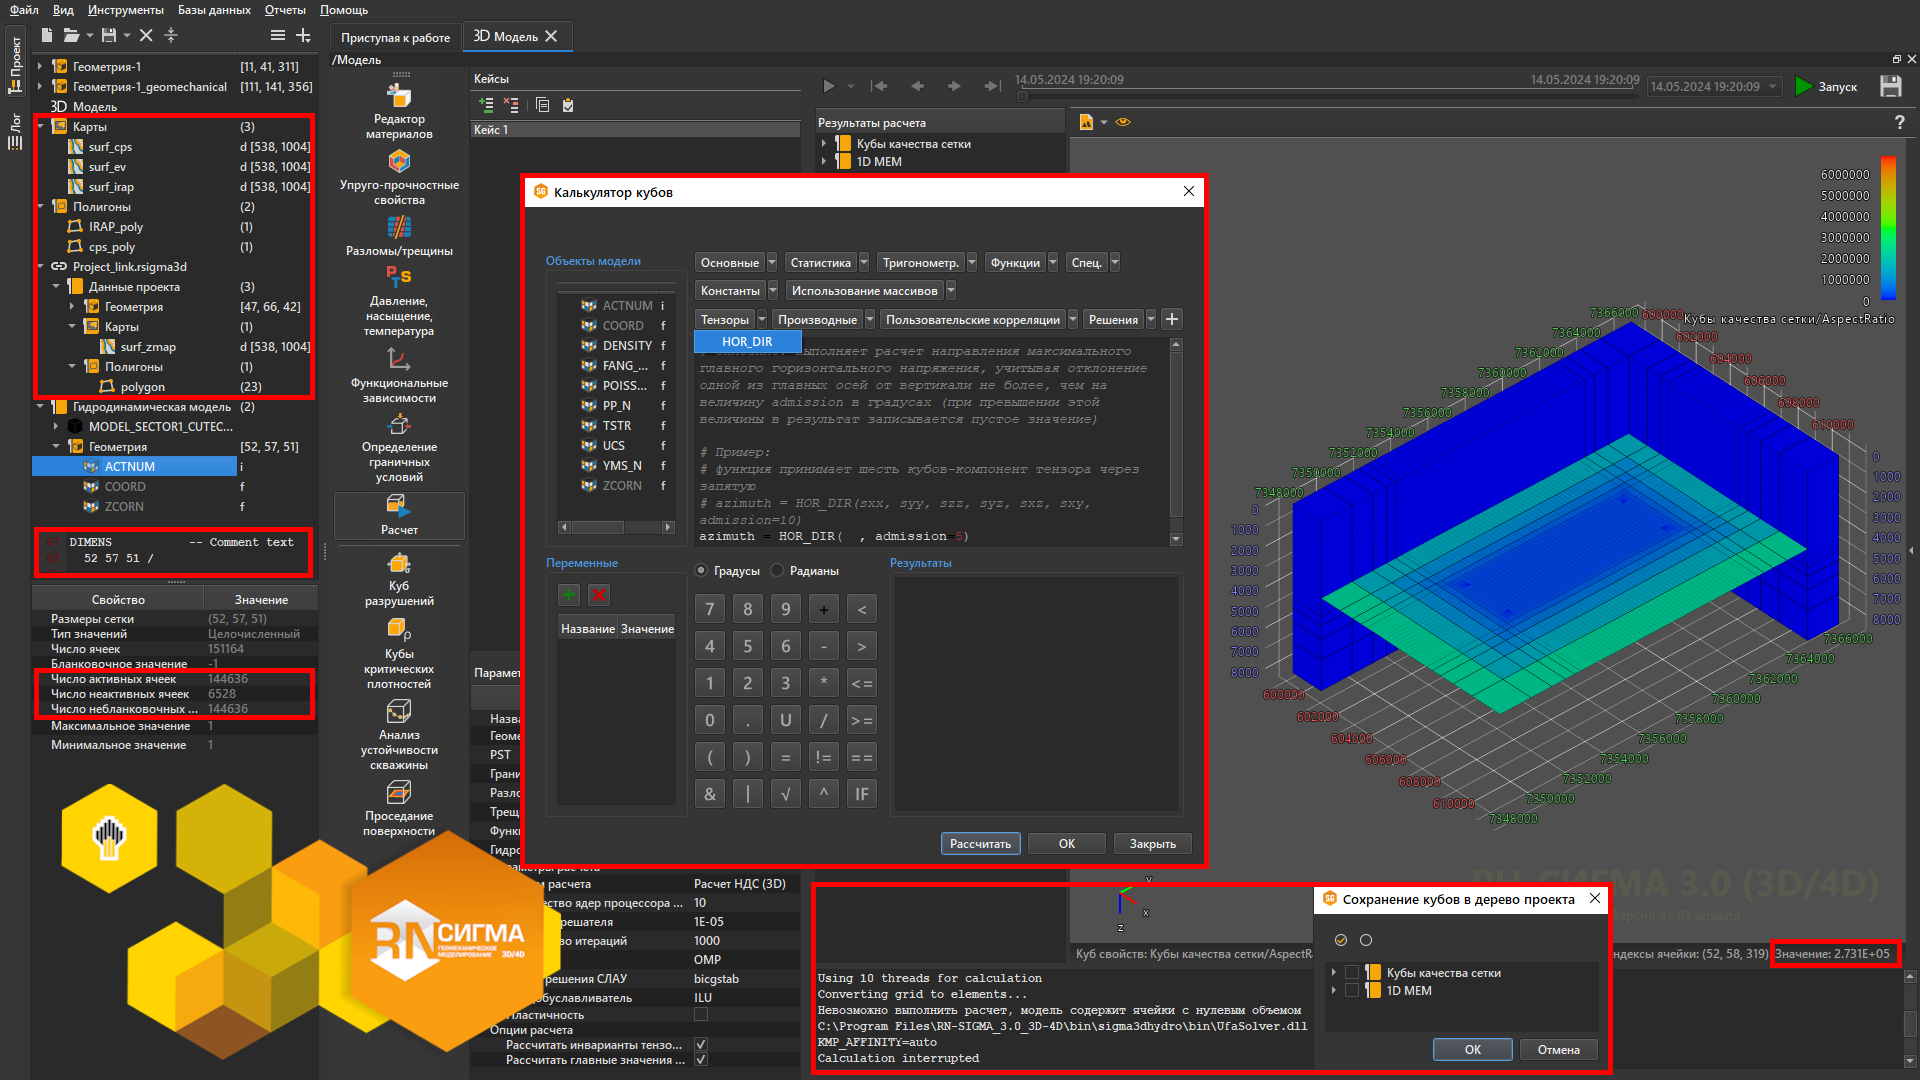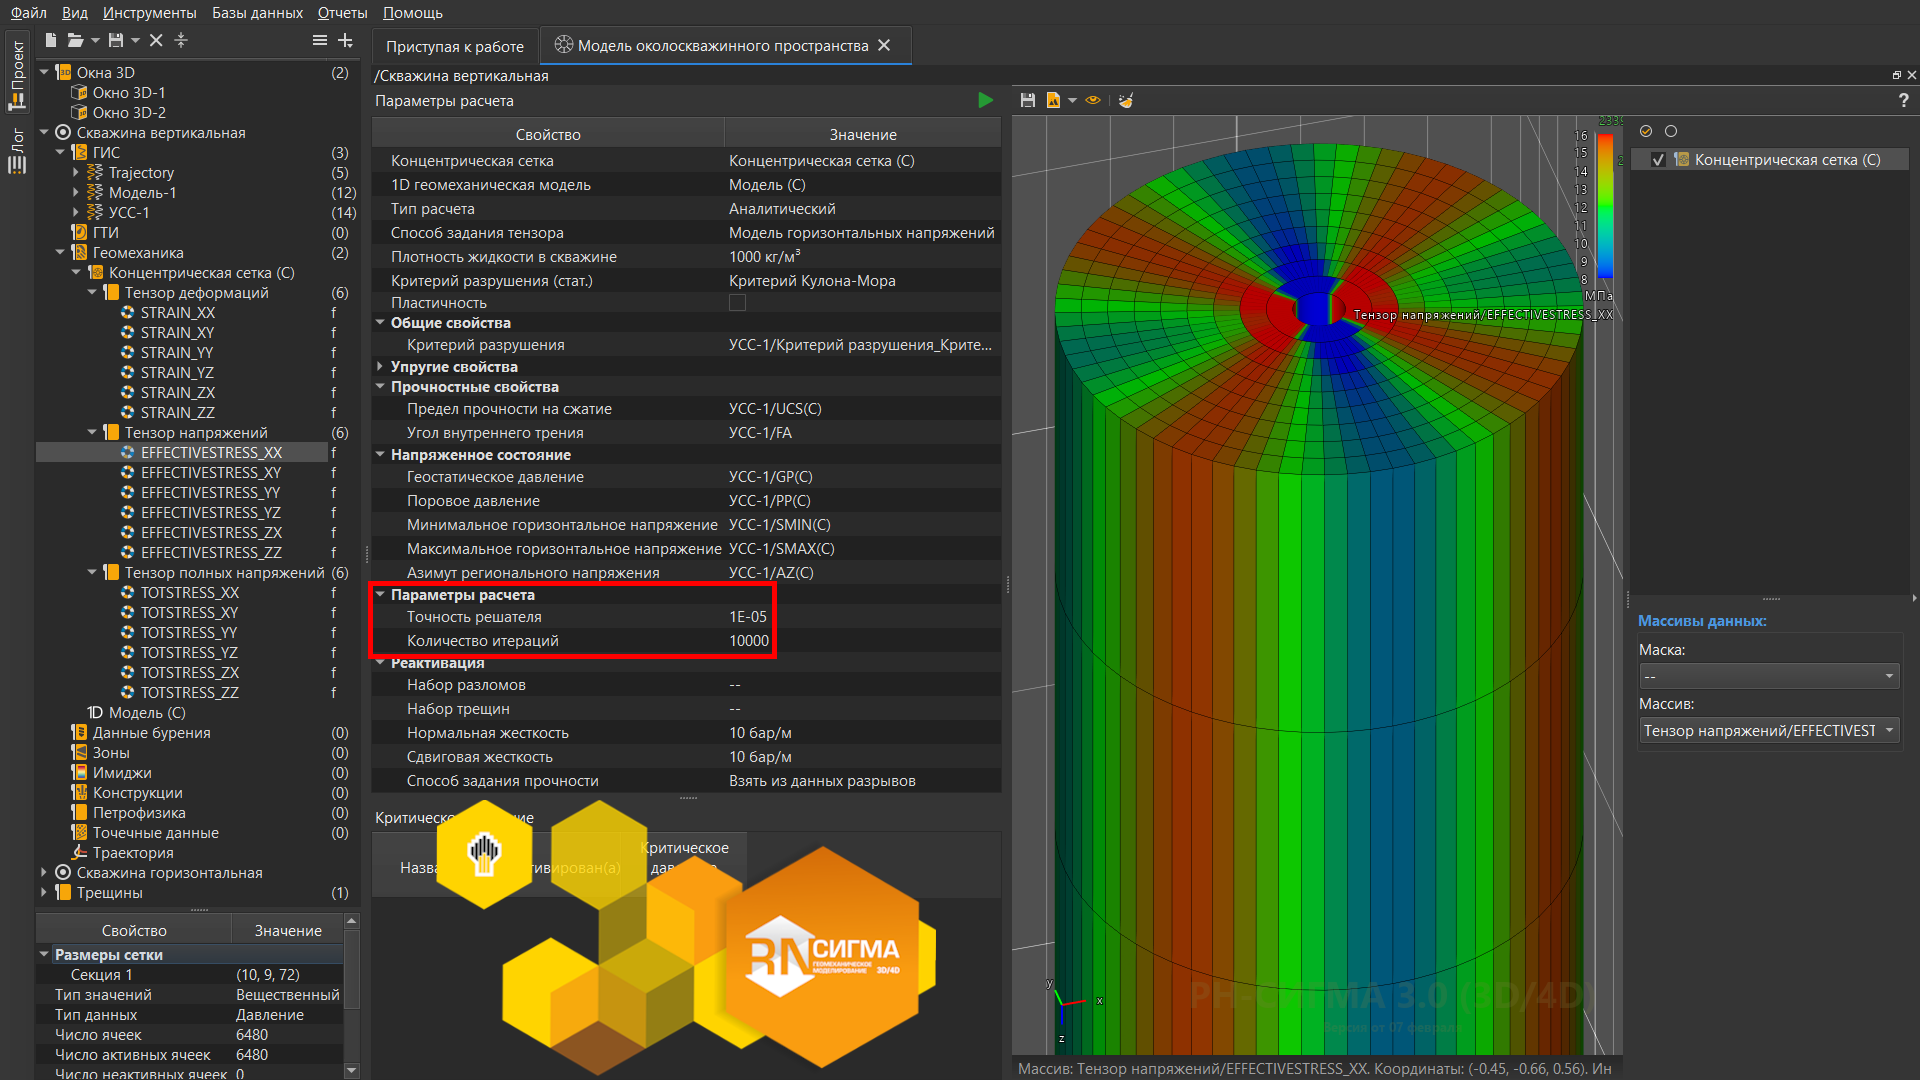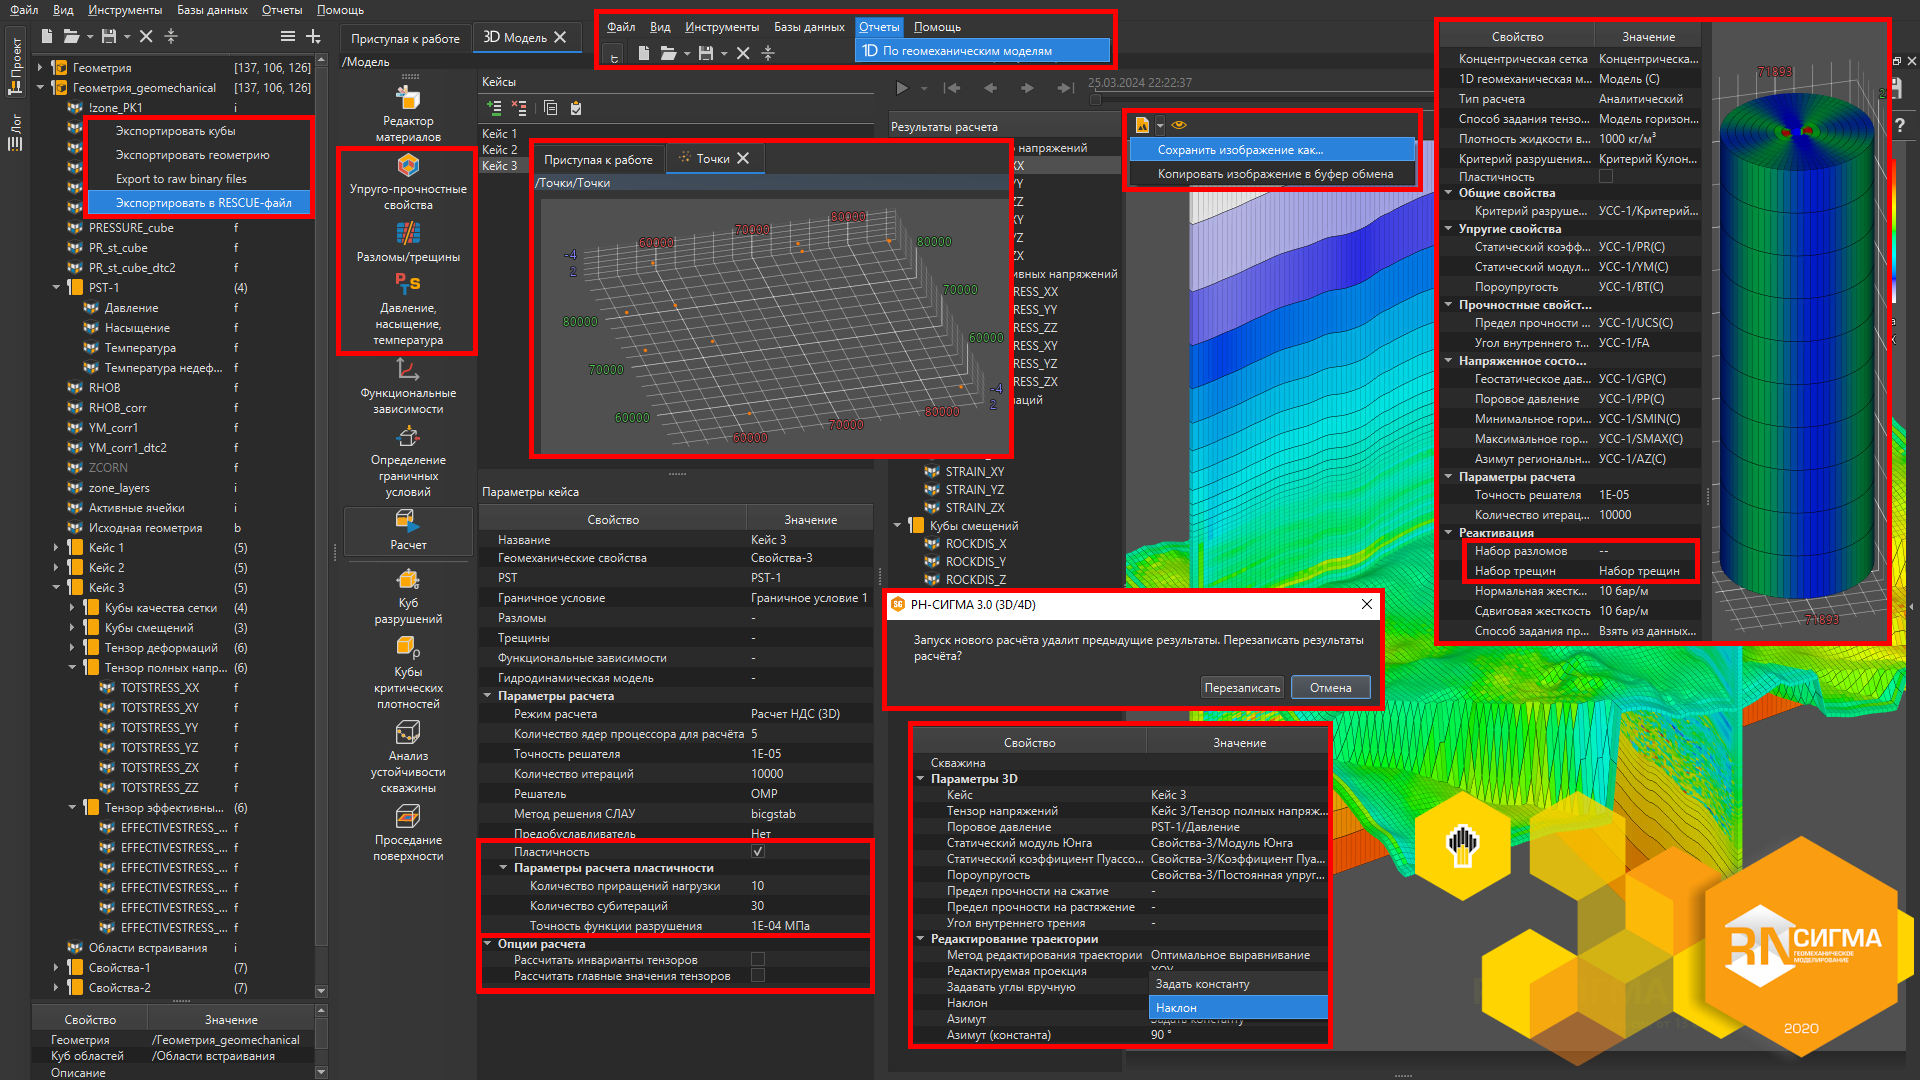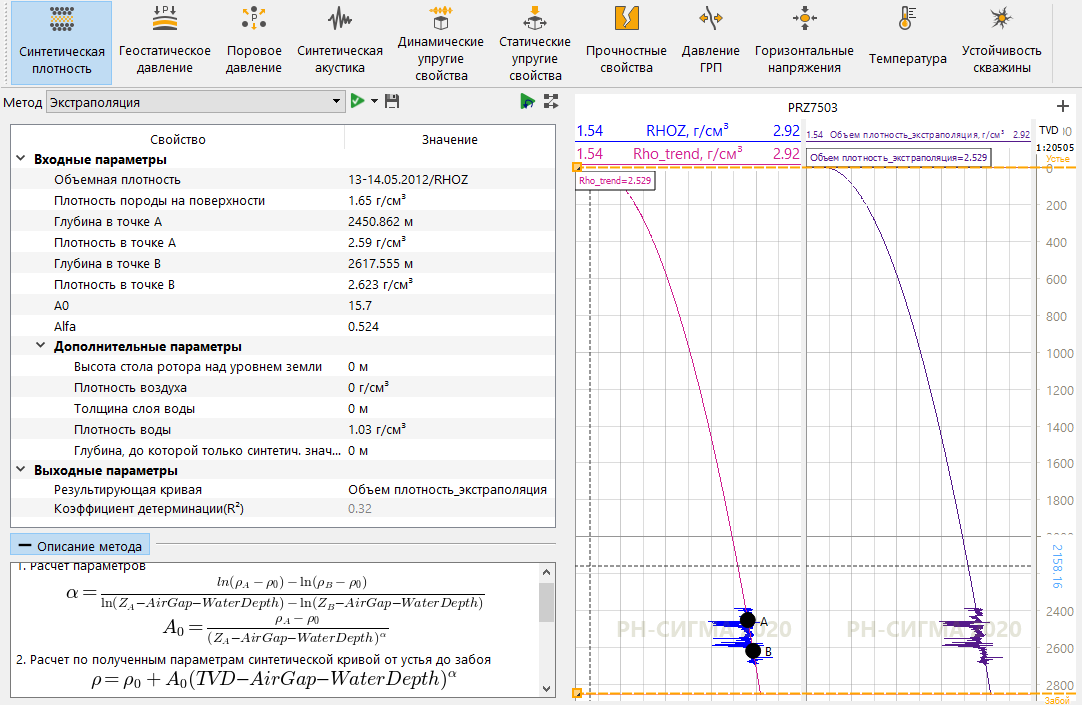
Drilling Risk Management
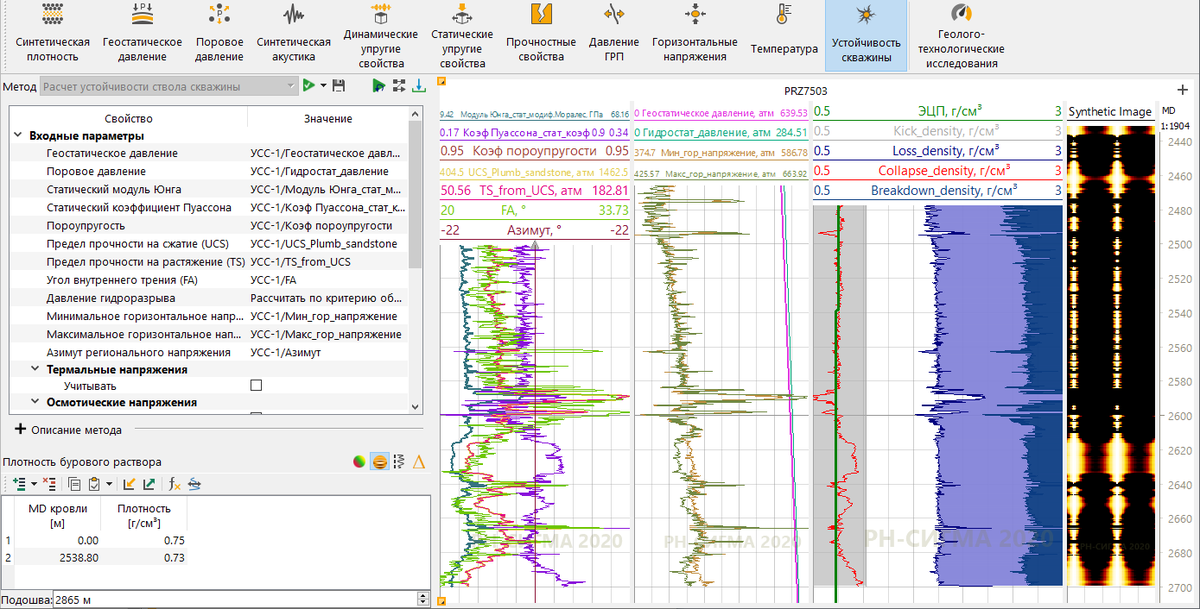
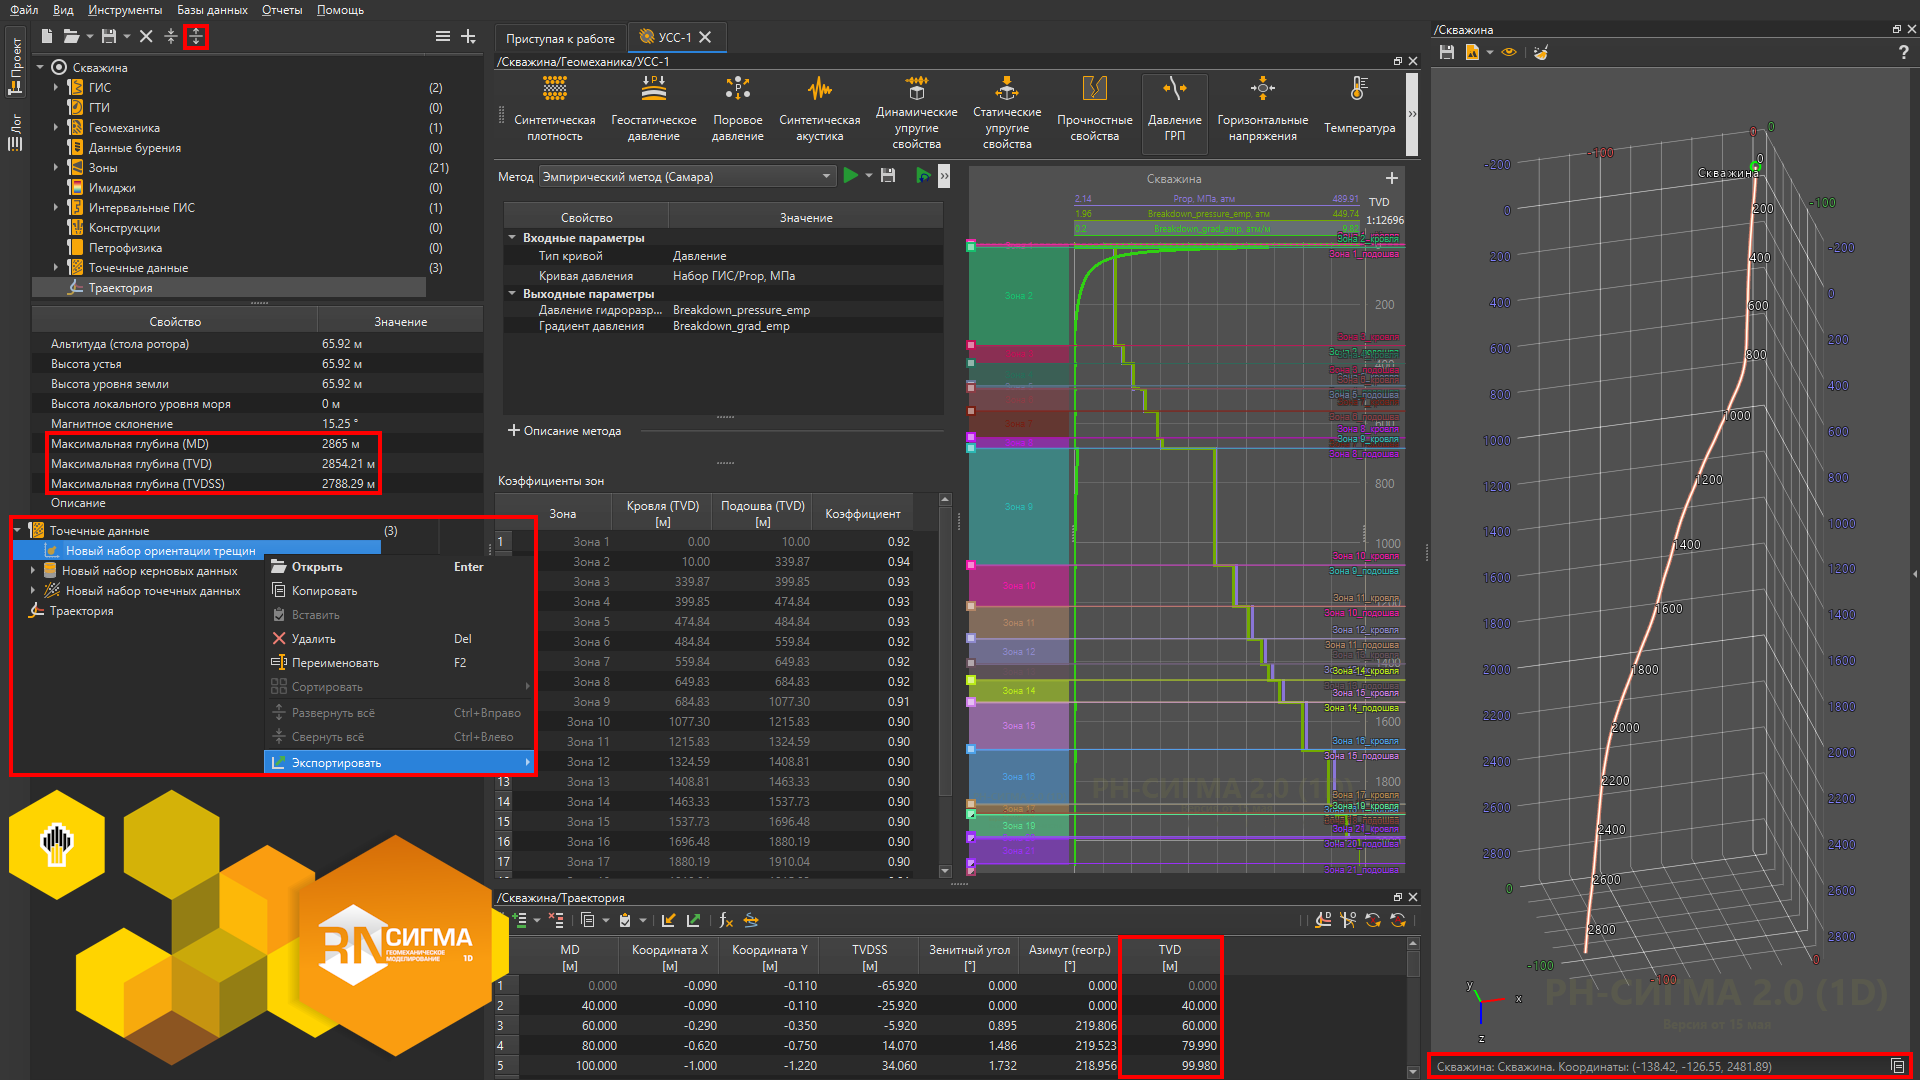
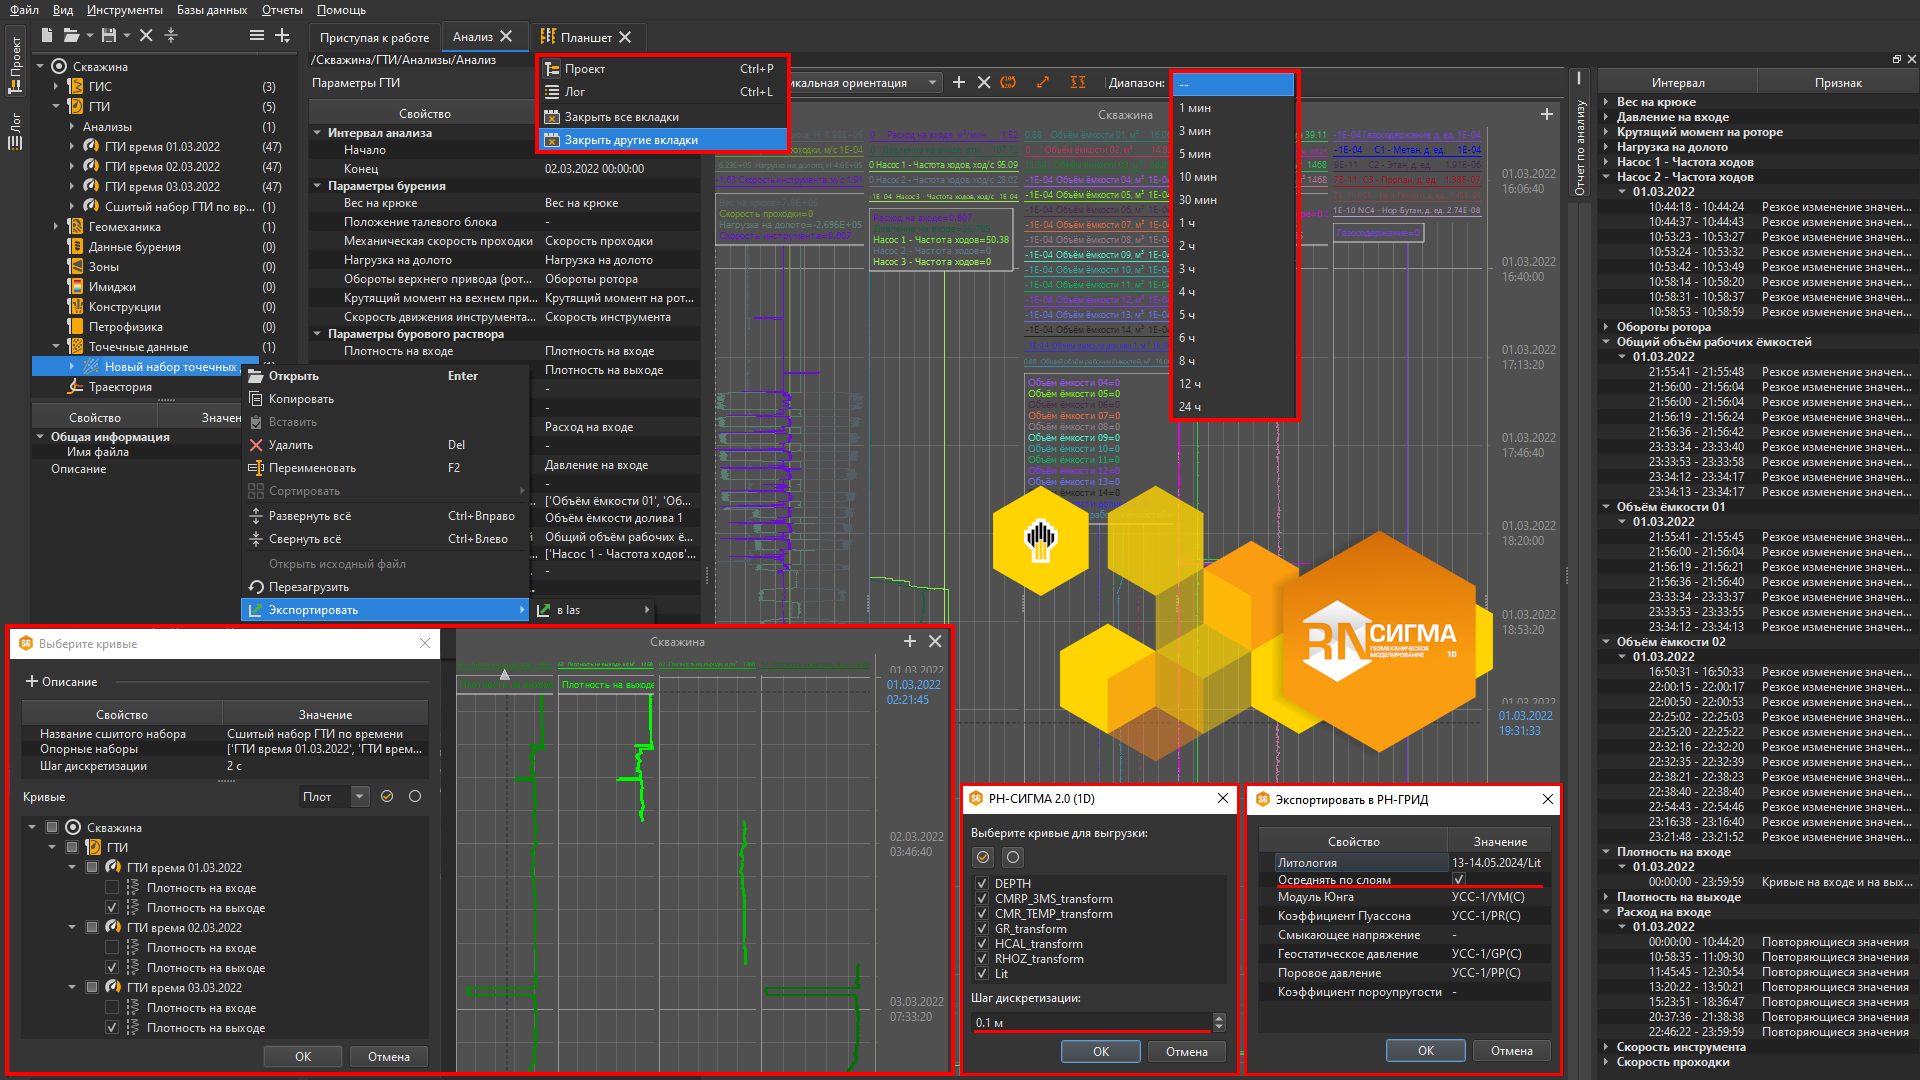
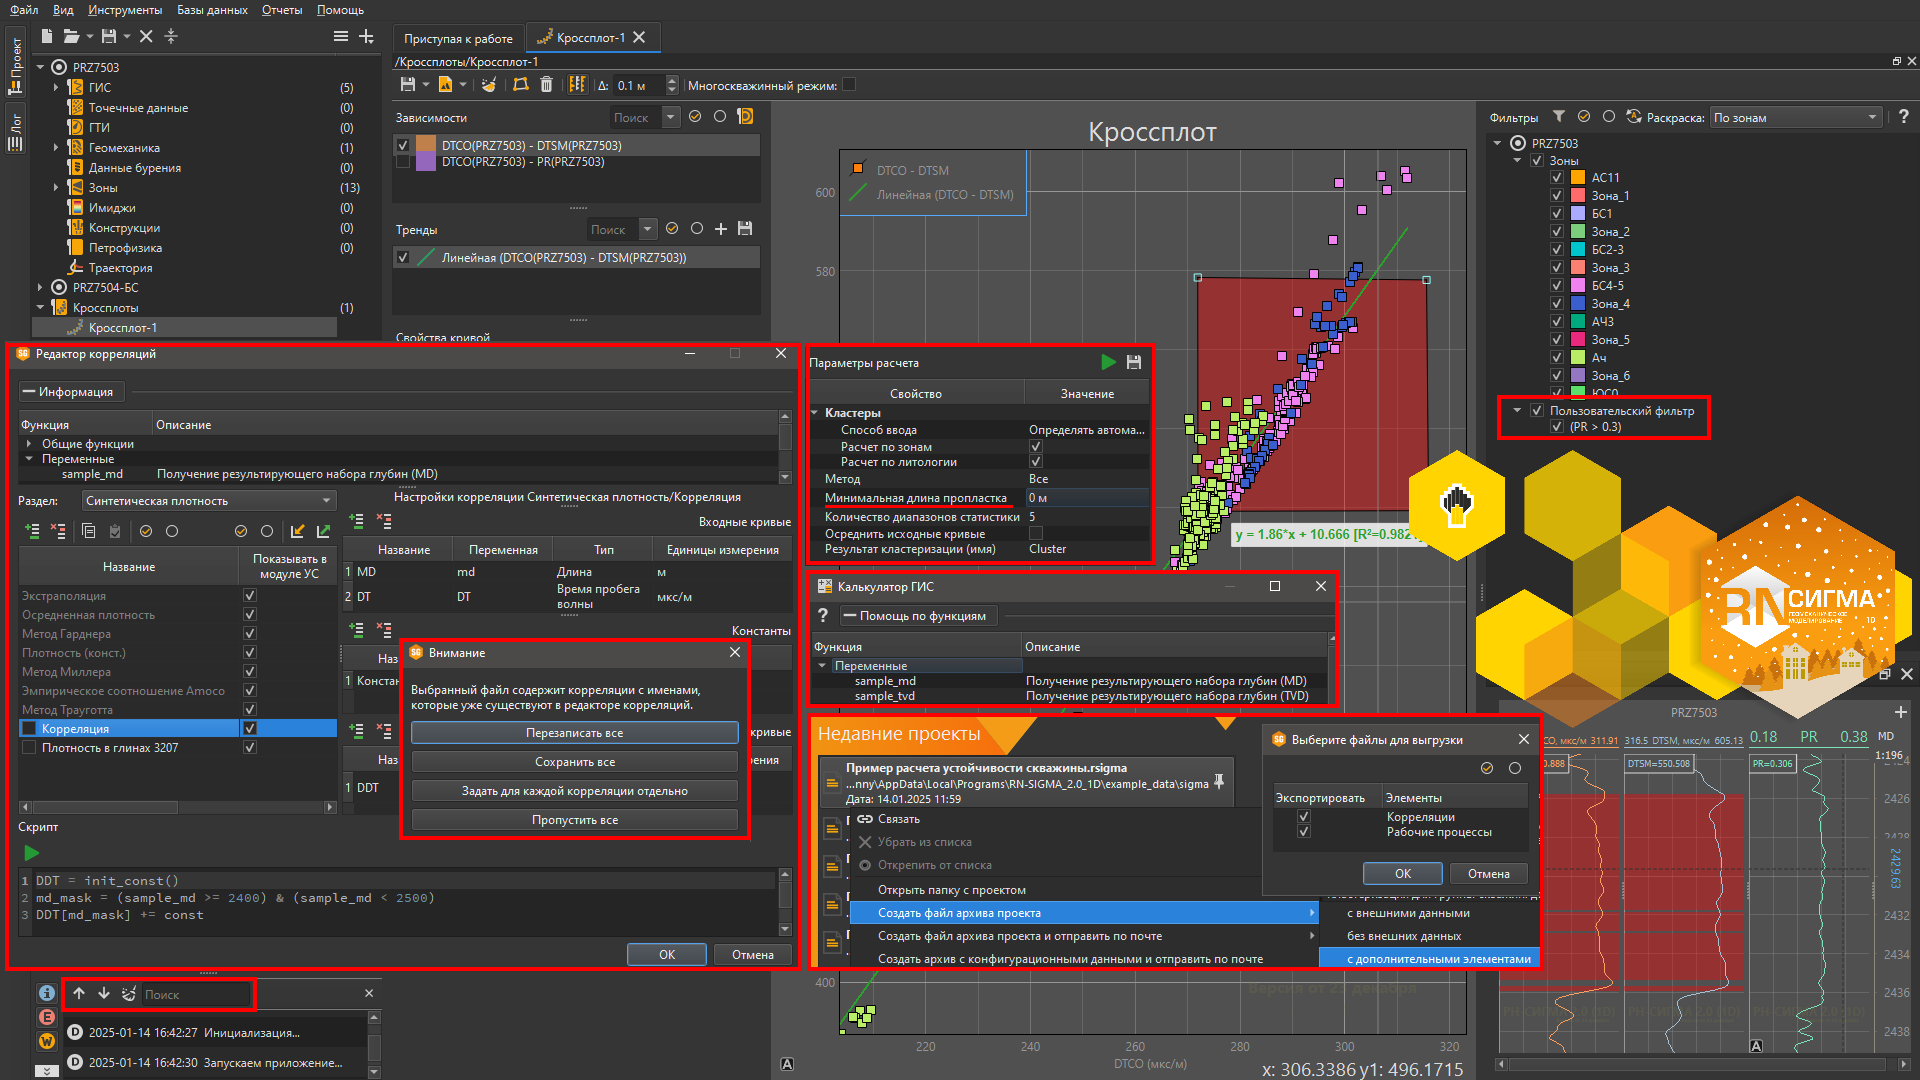
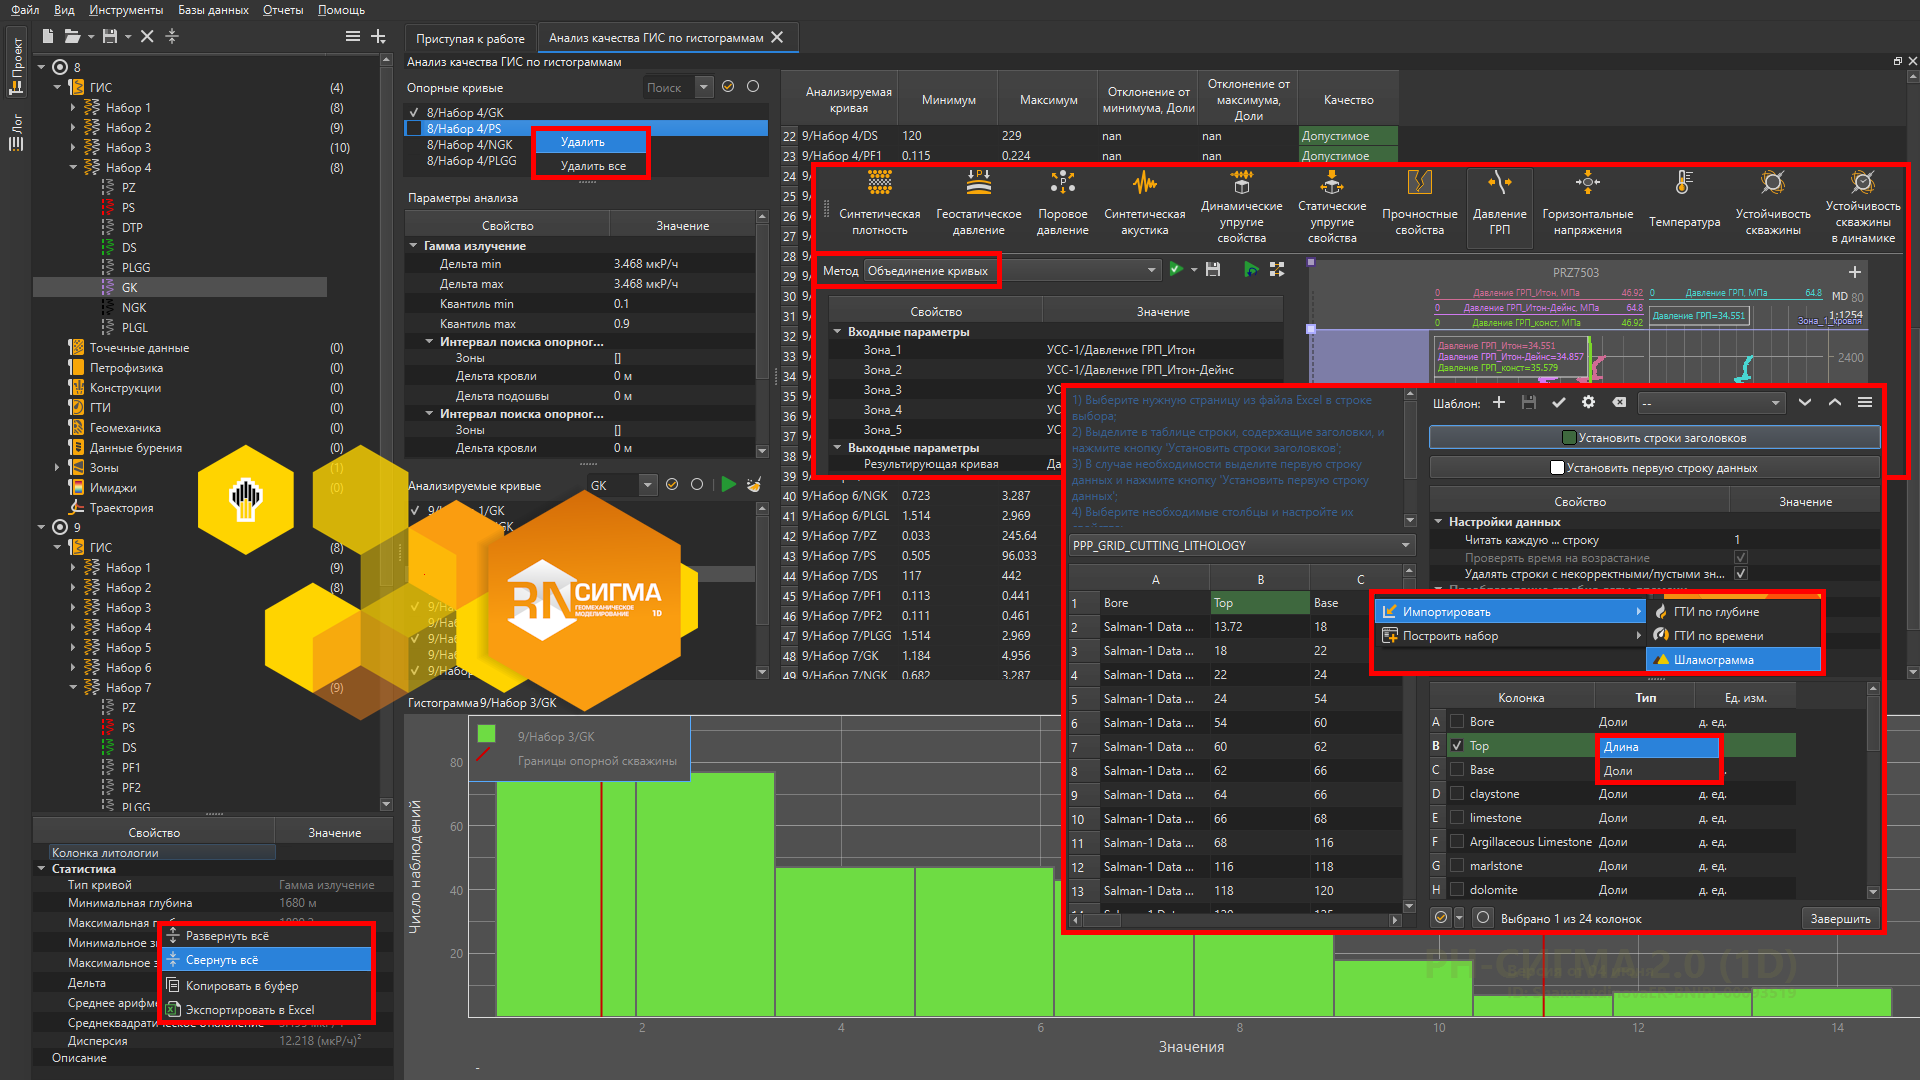
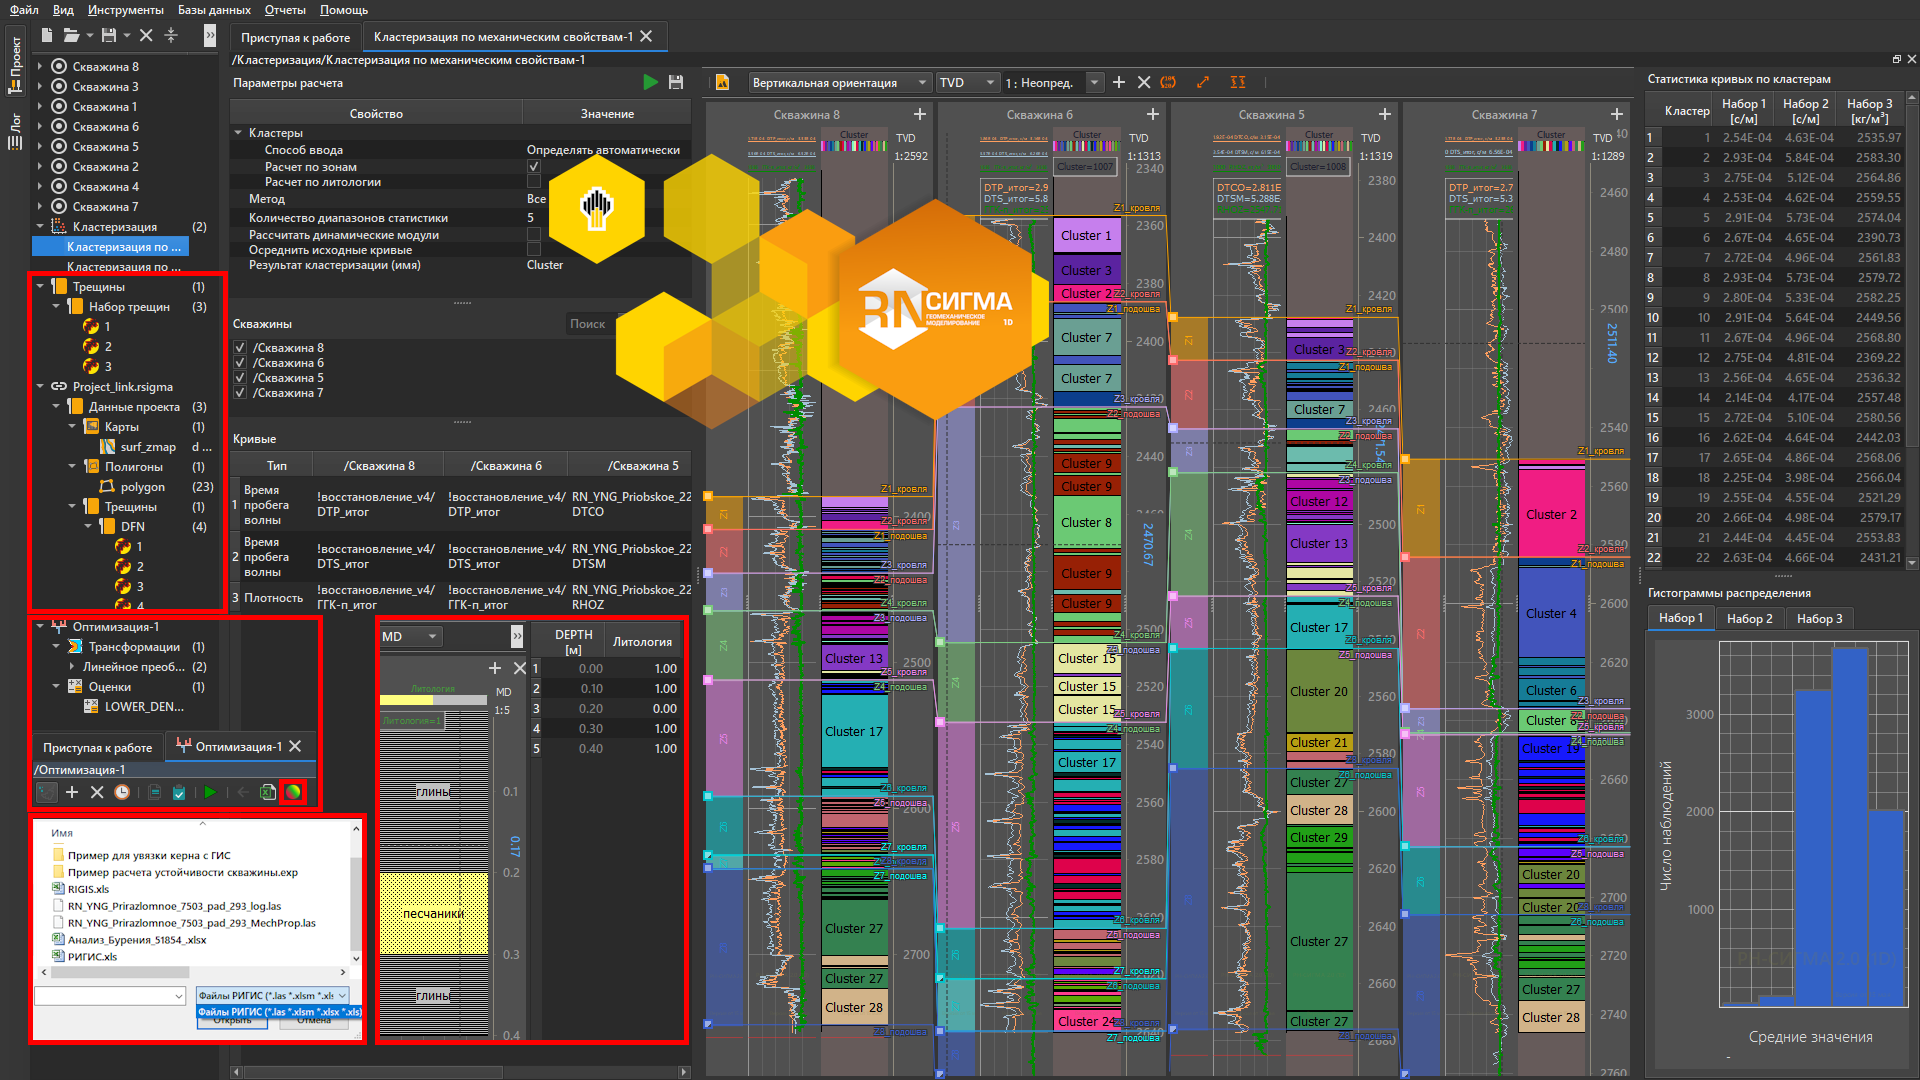
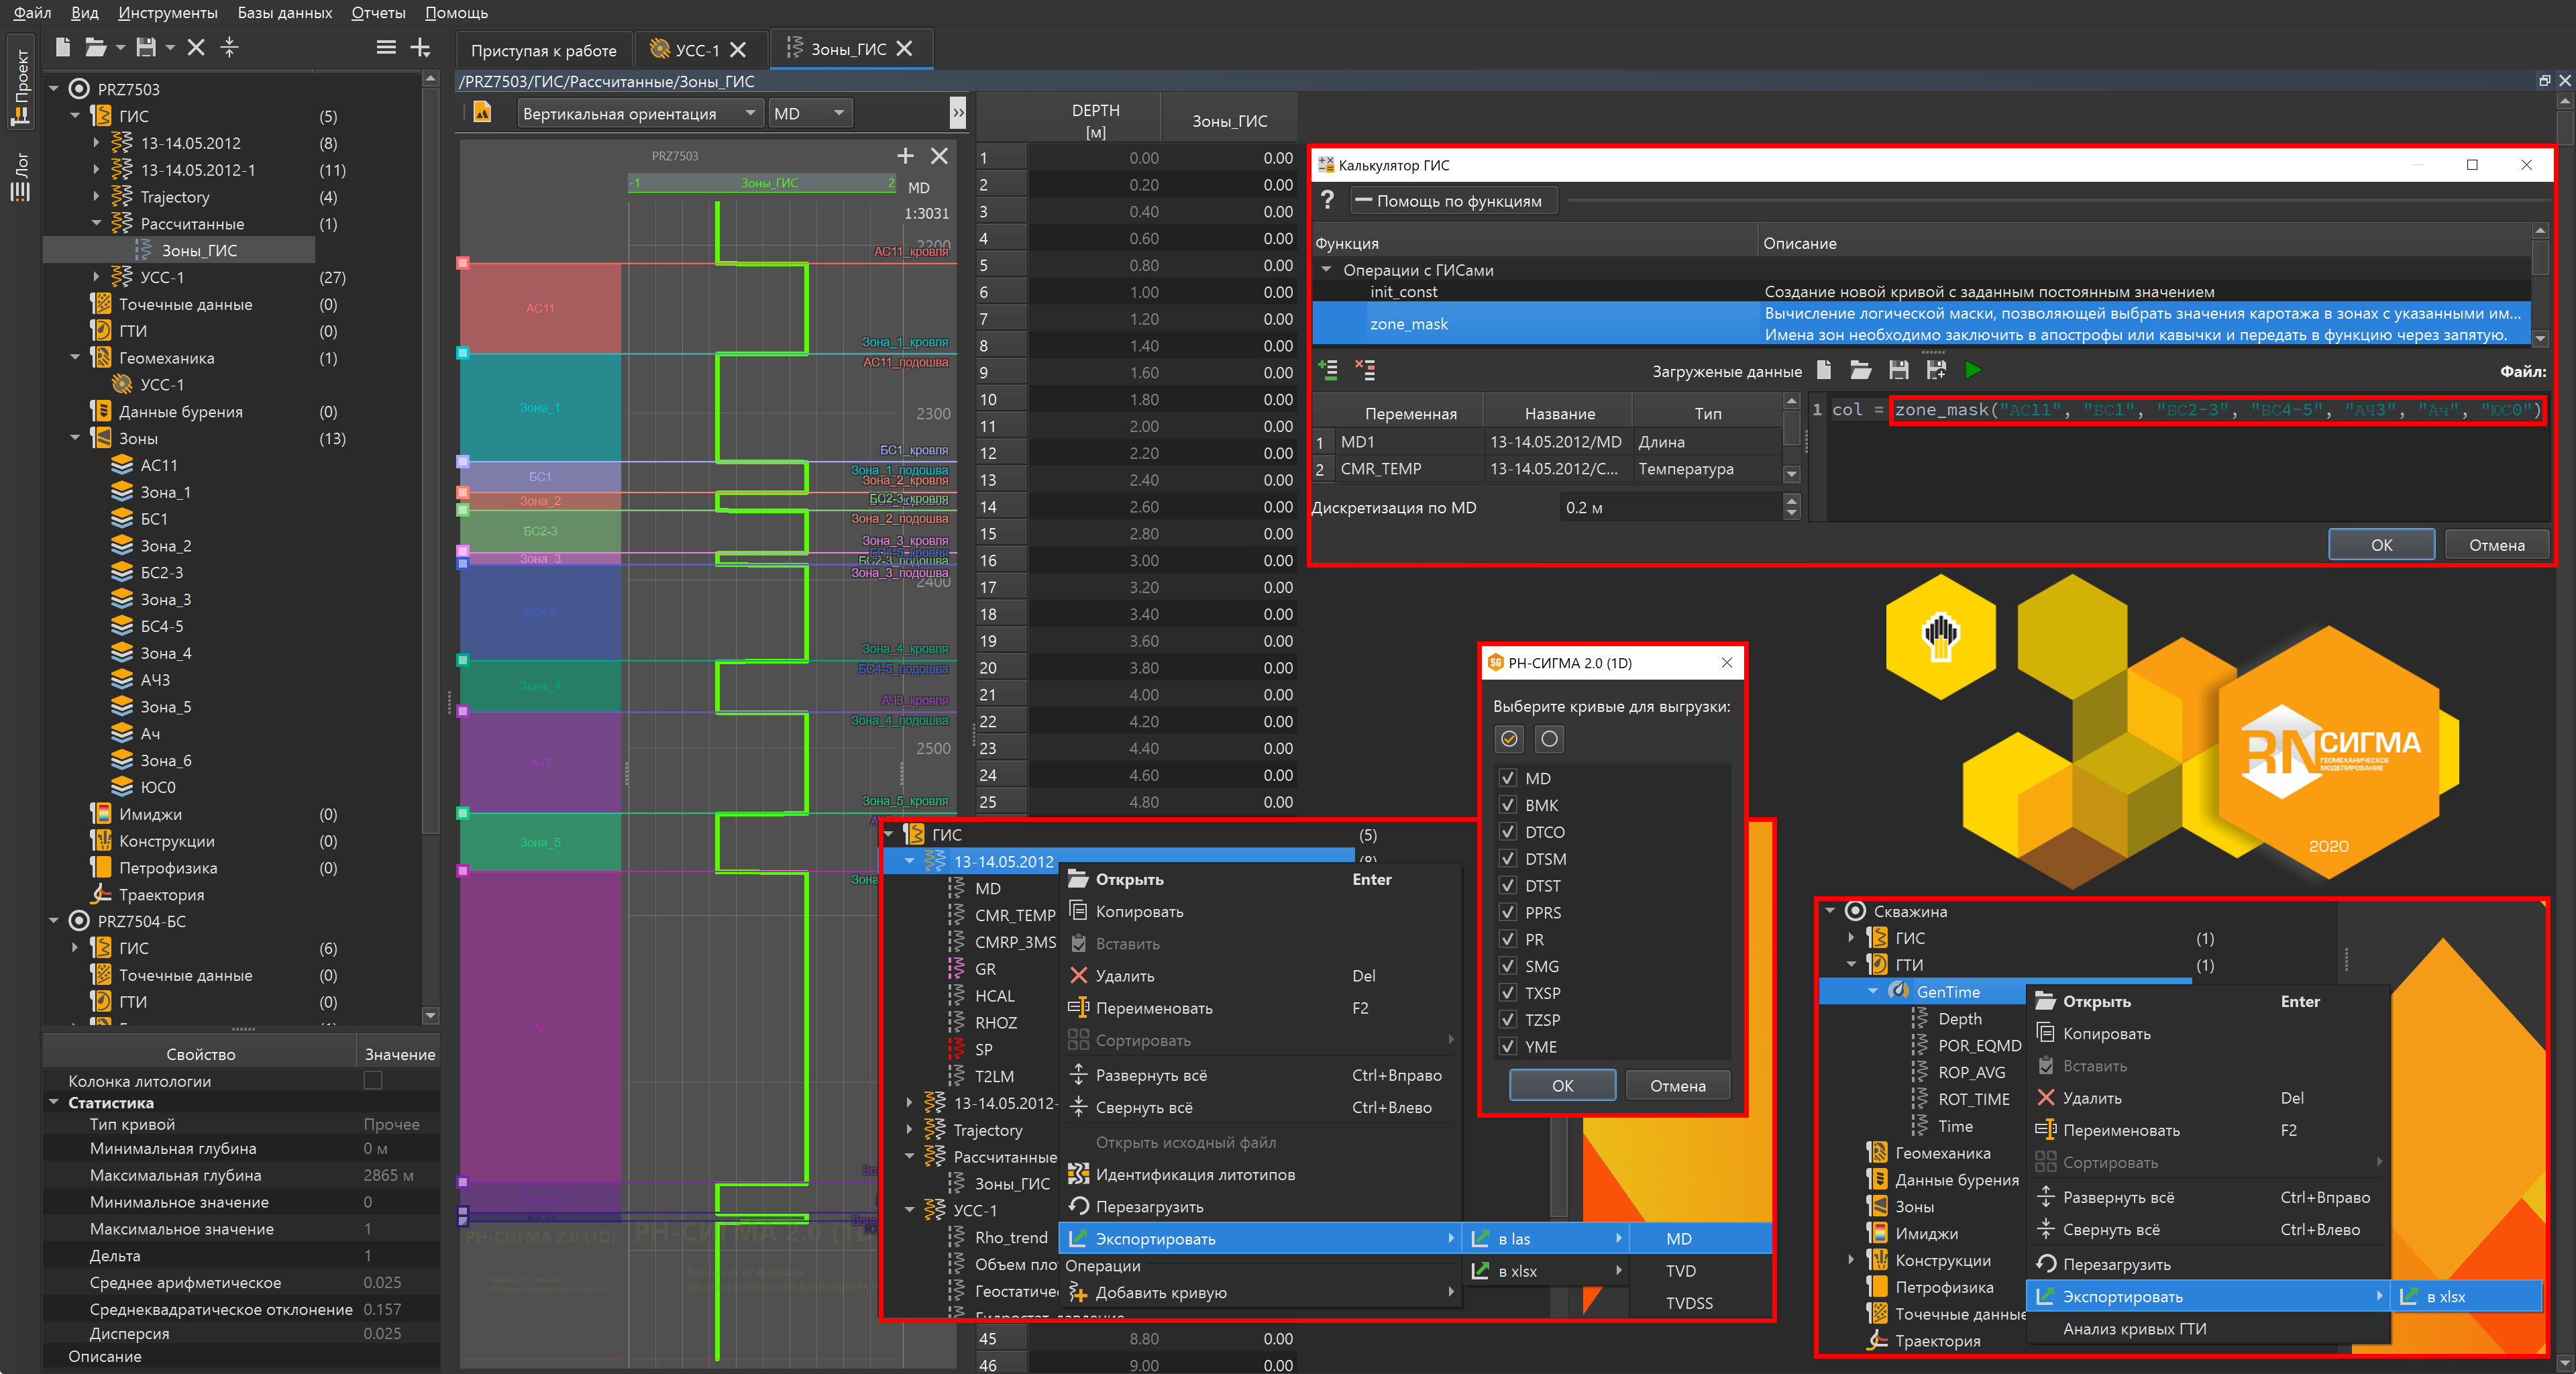
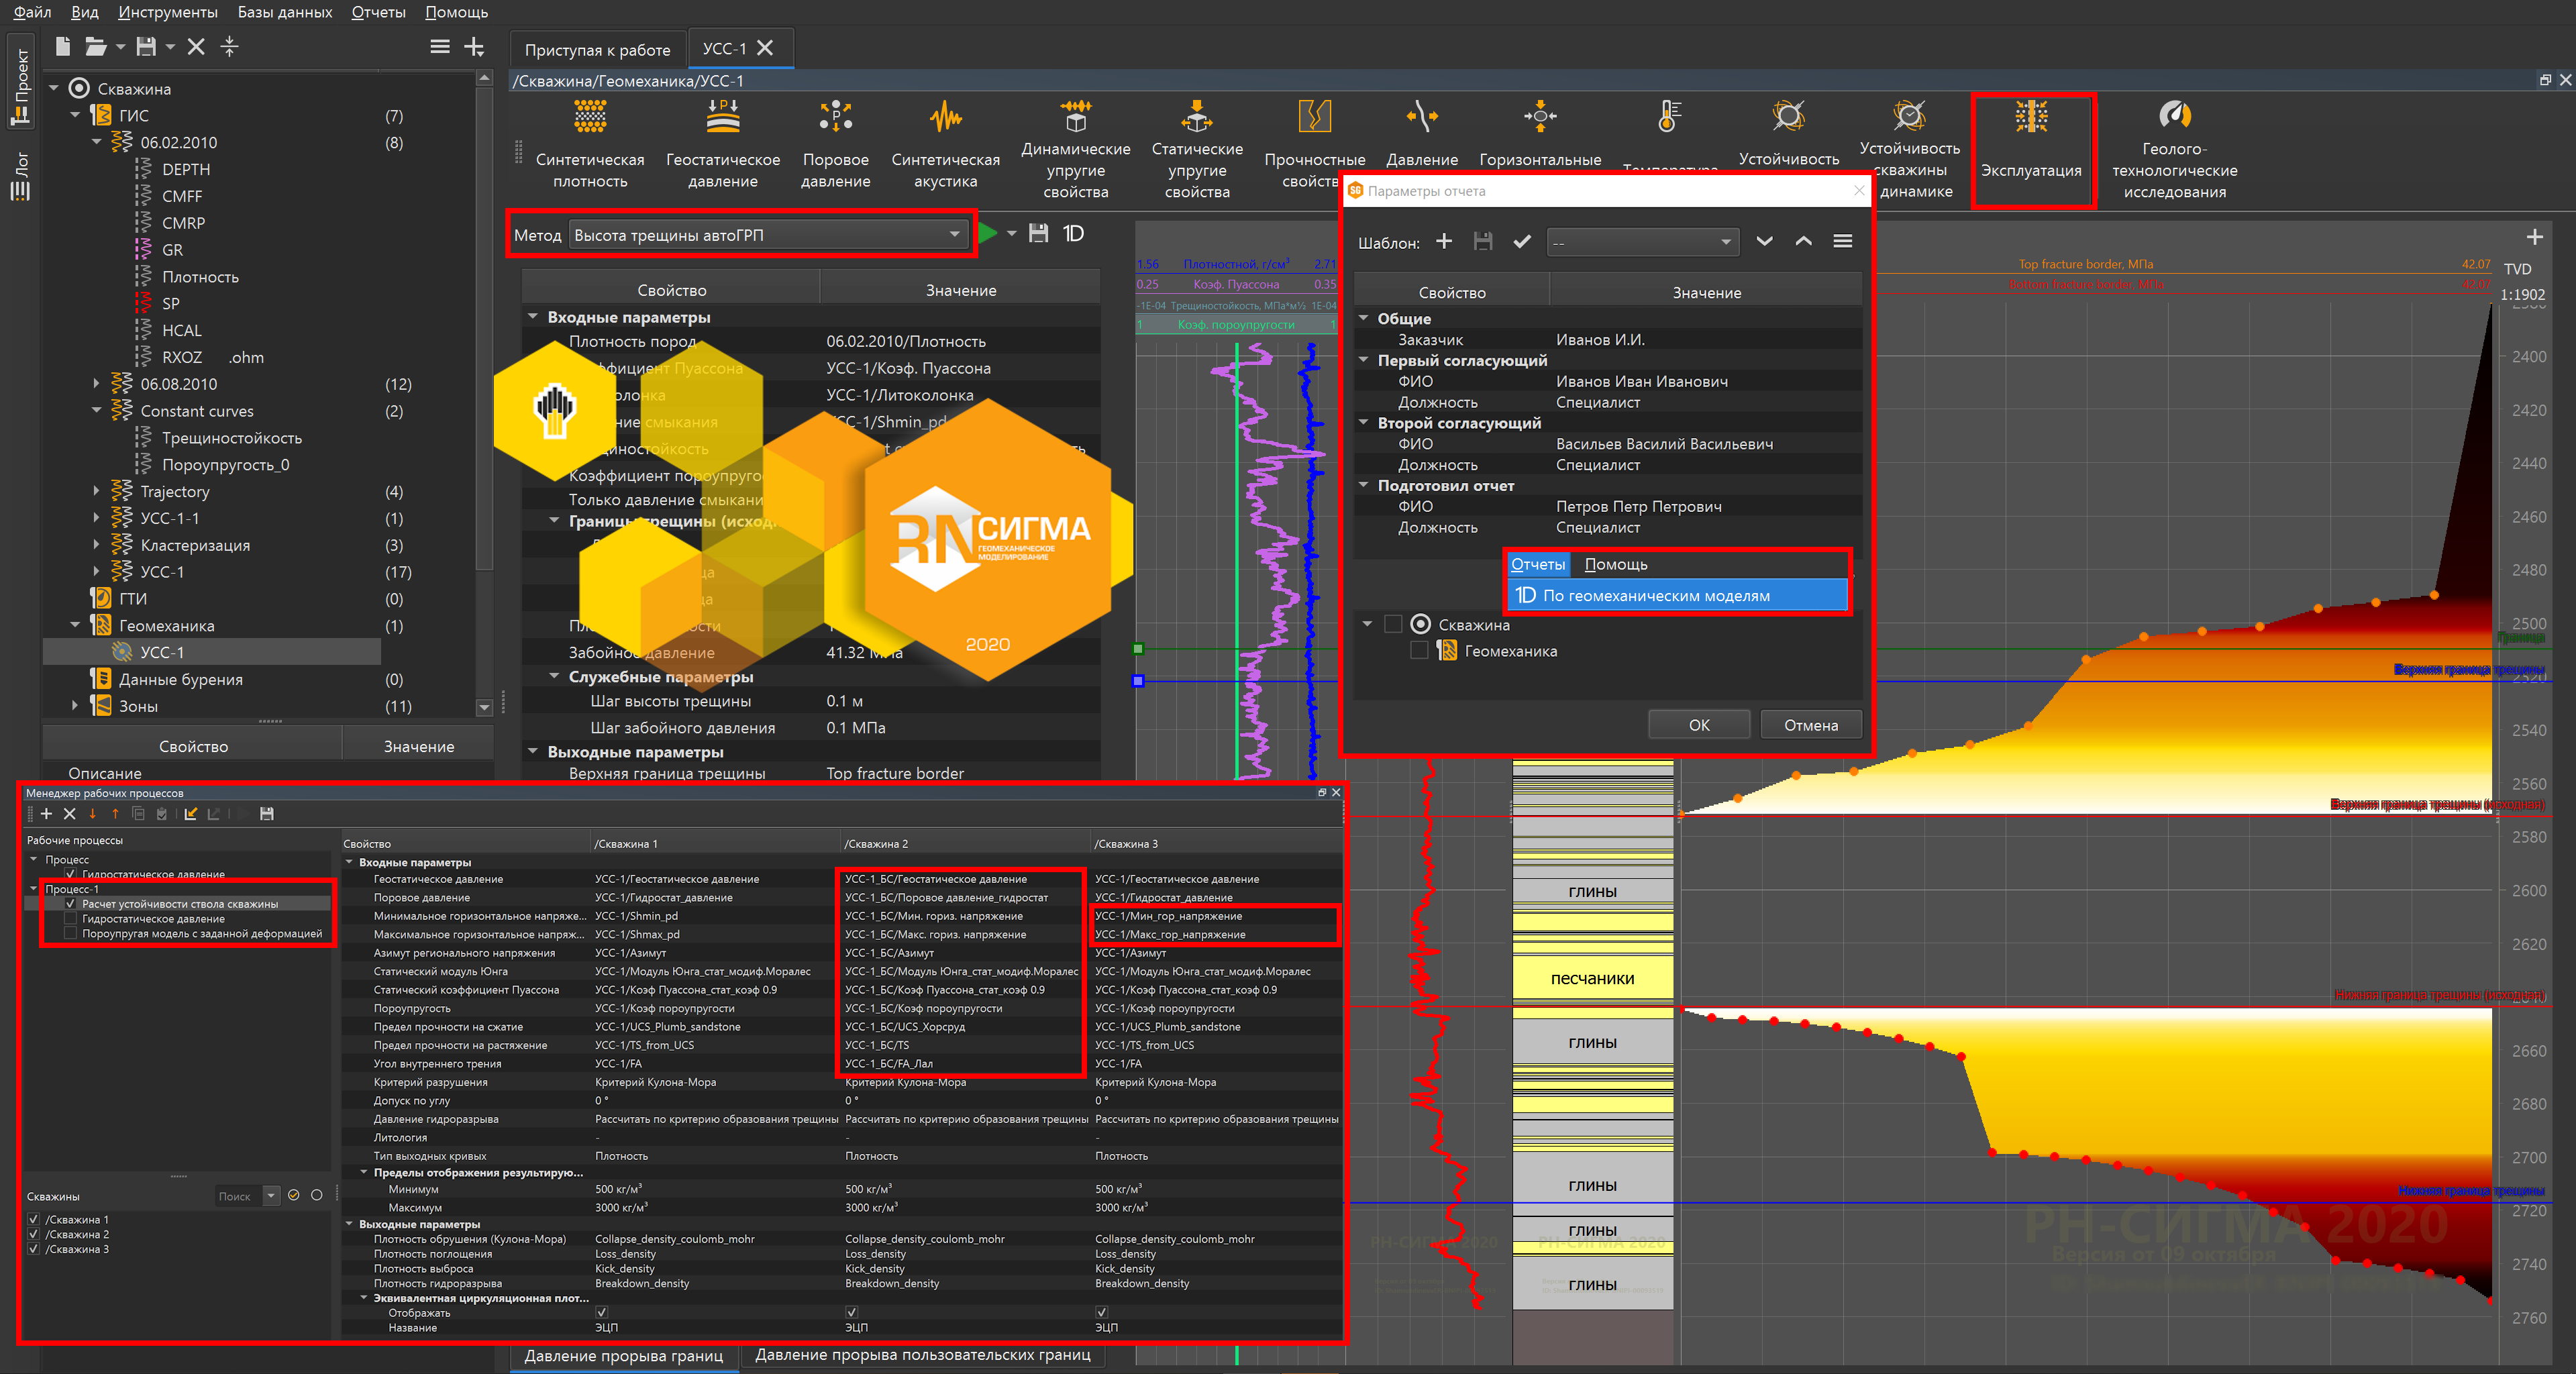
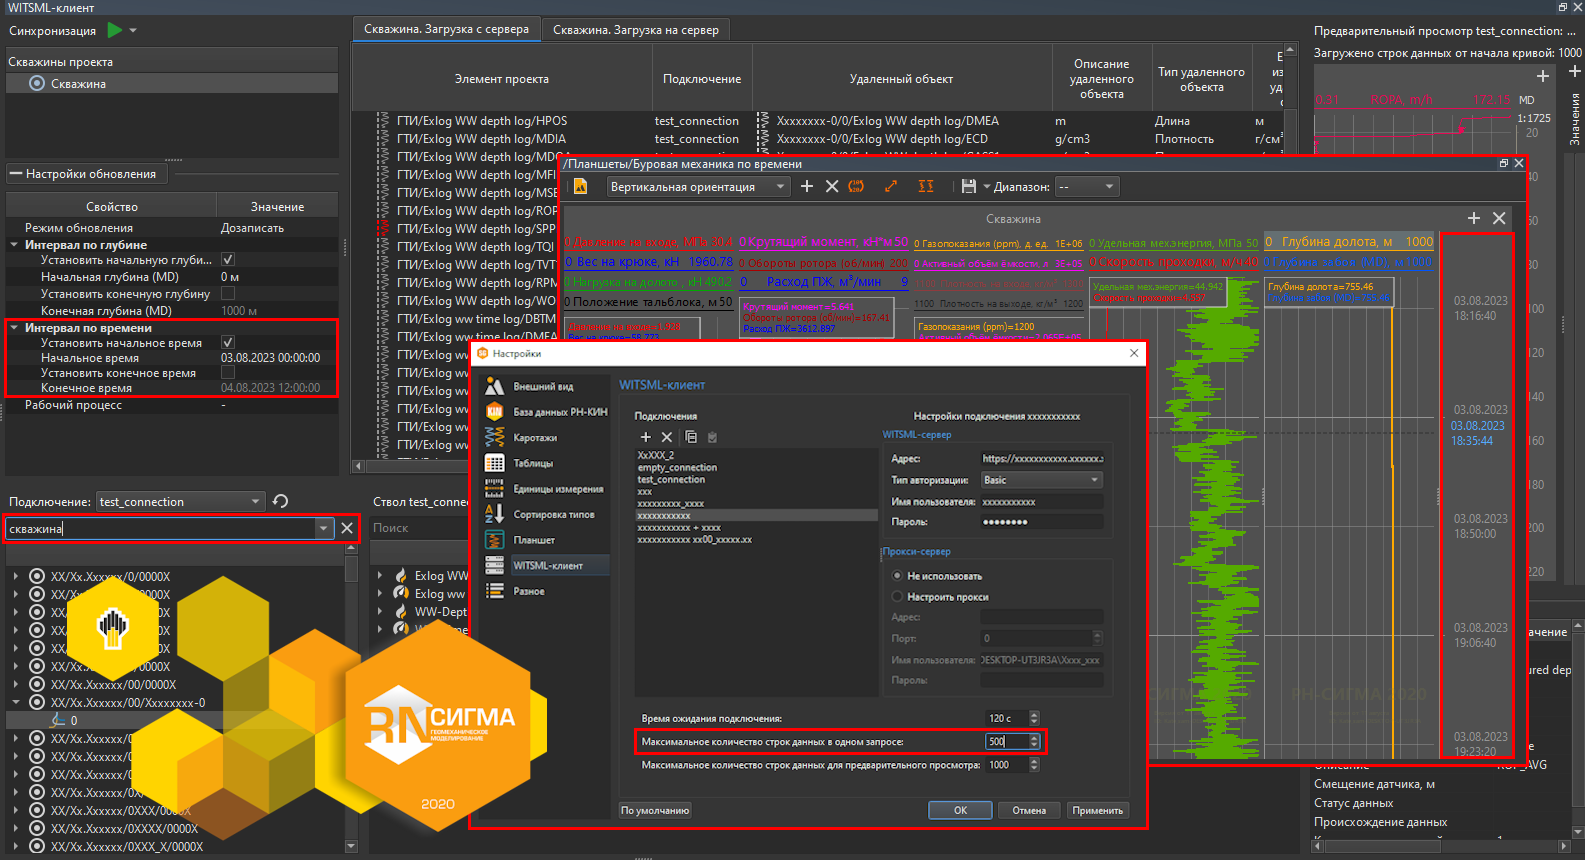
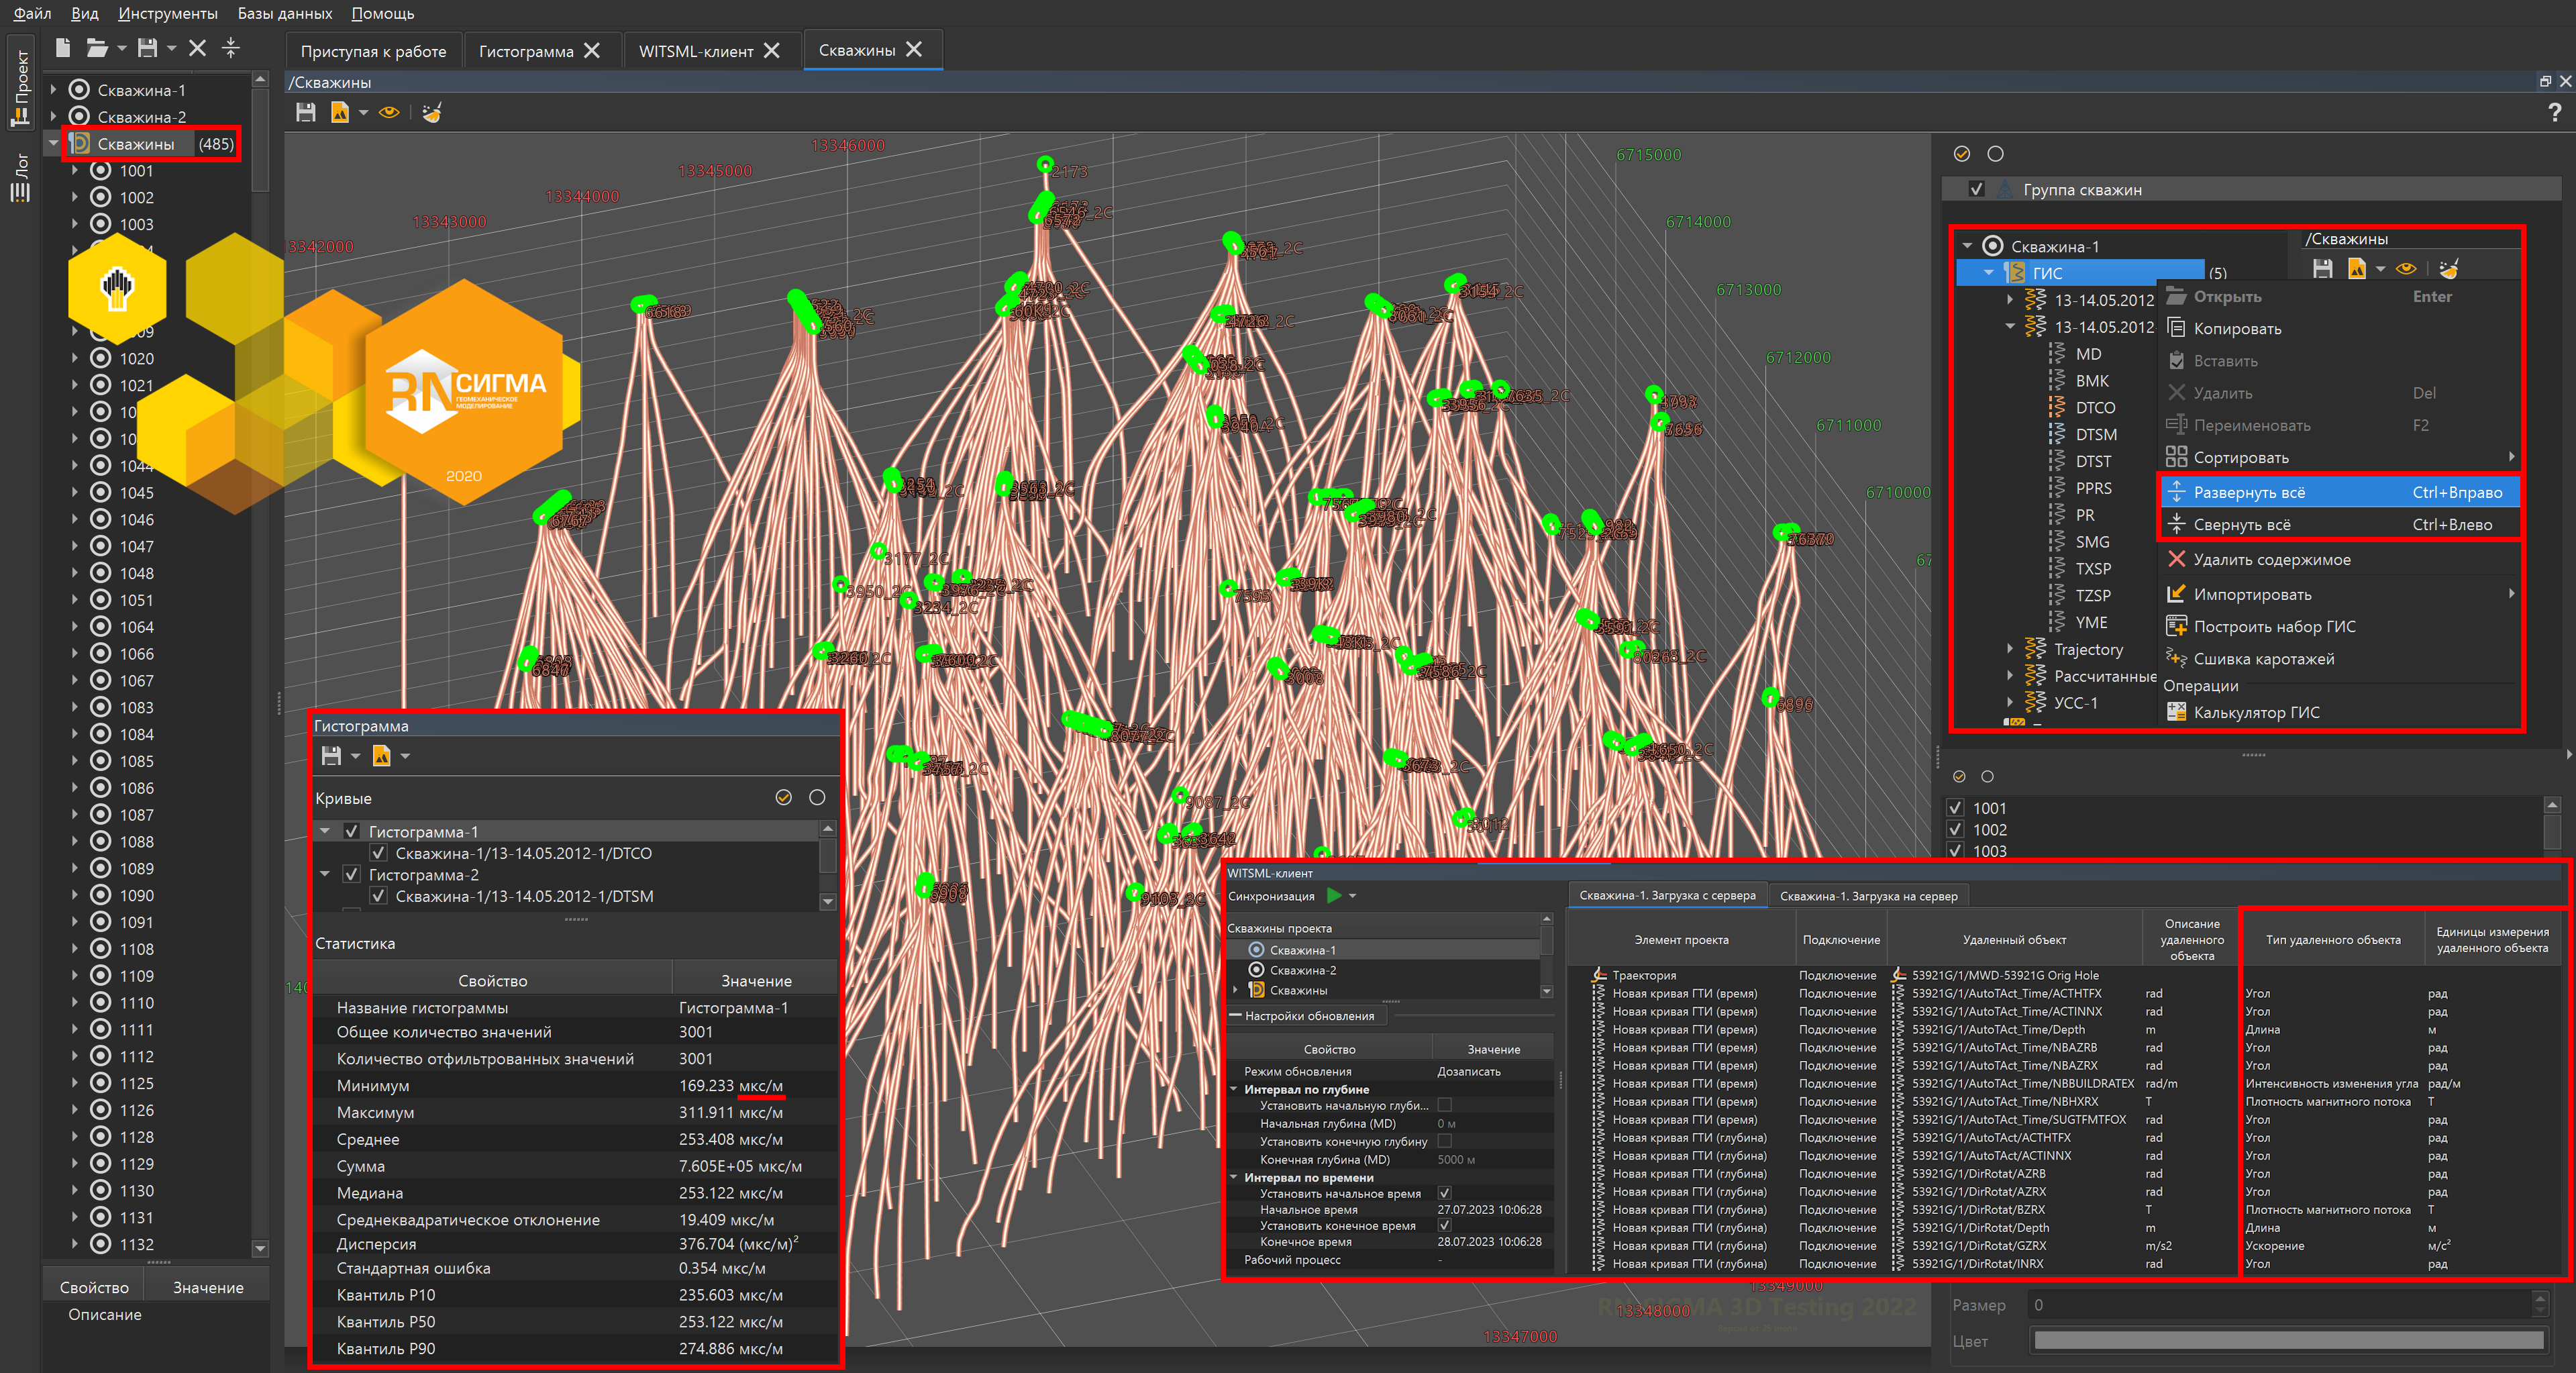
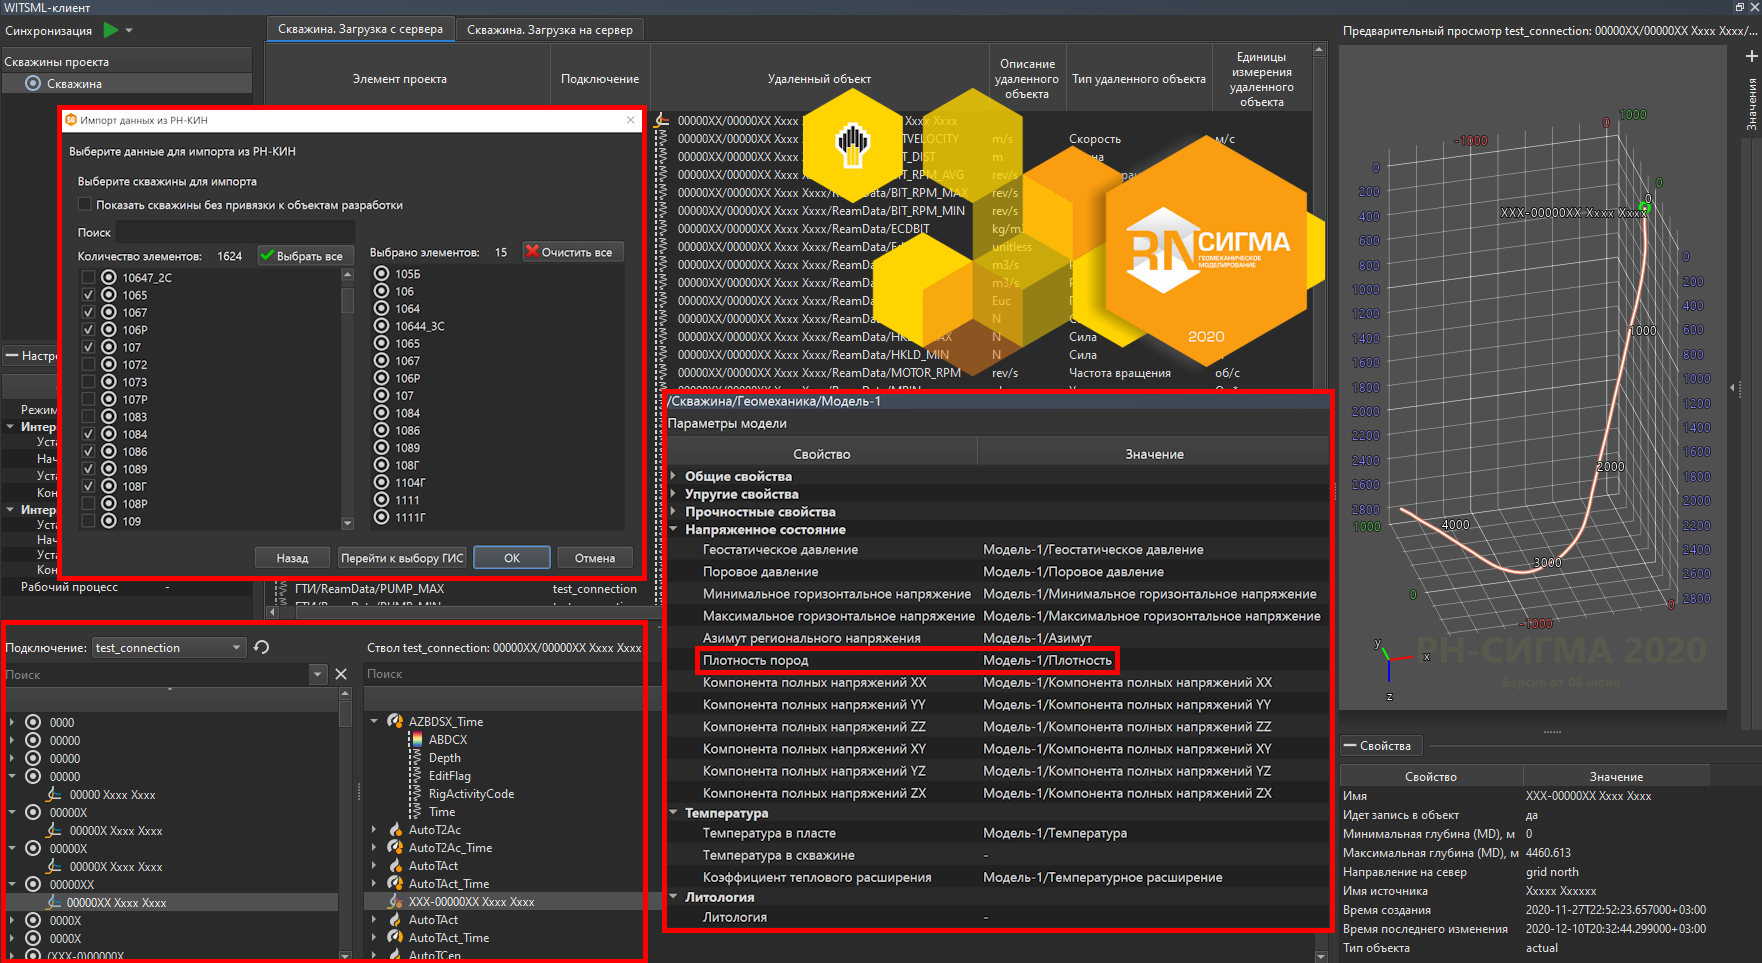
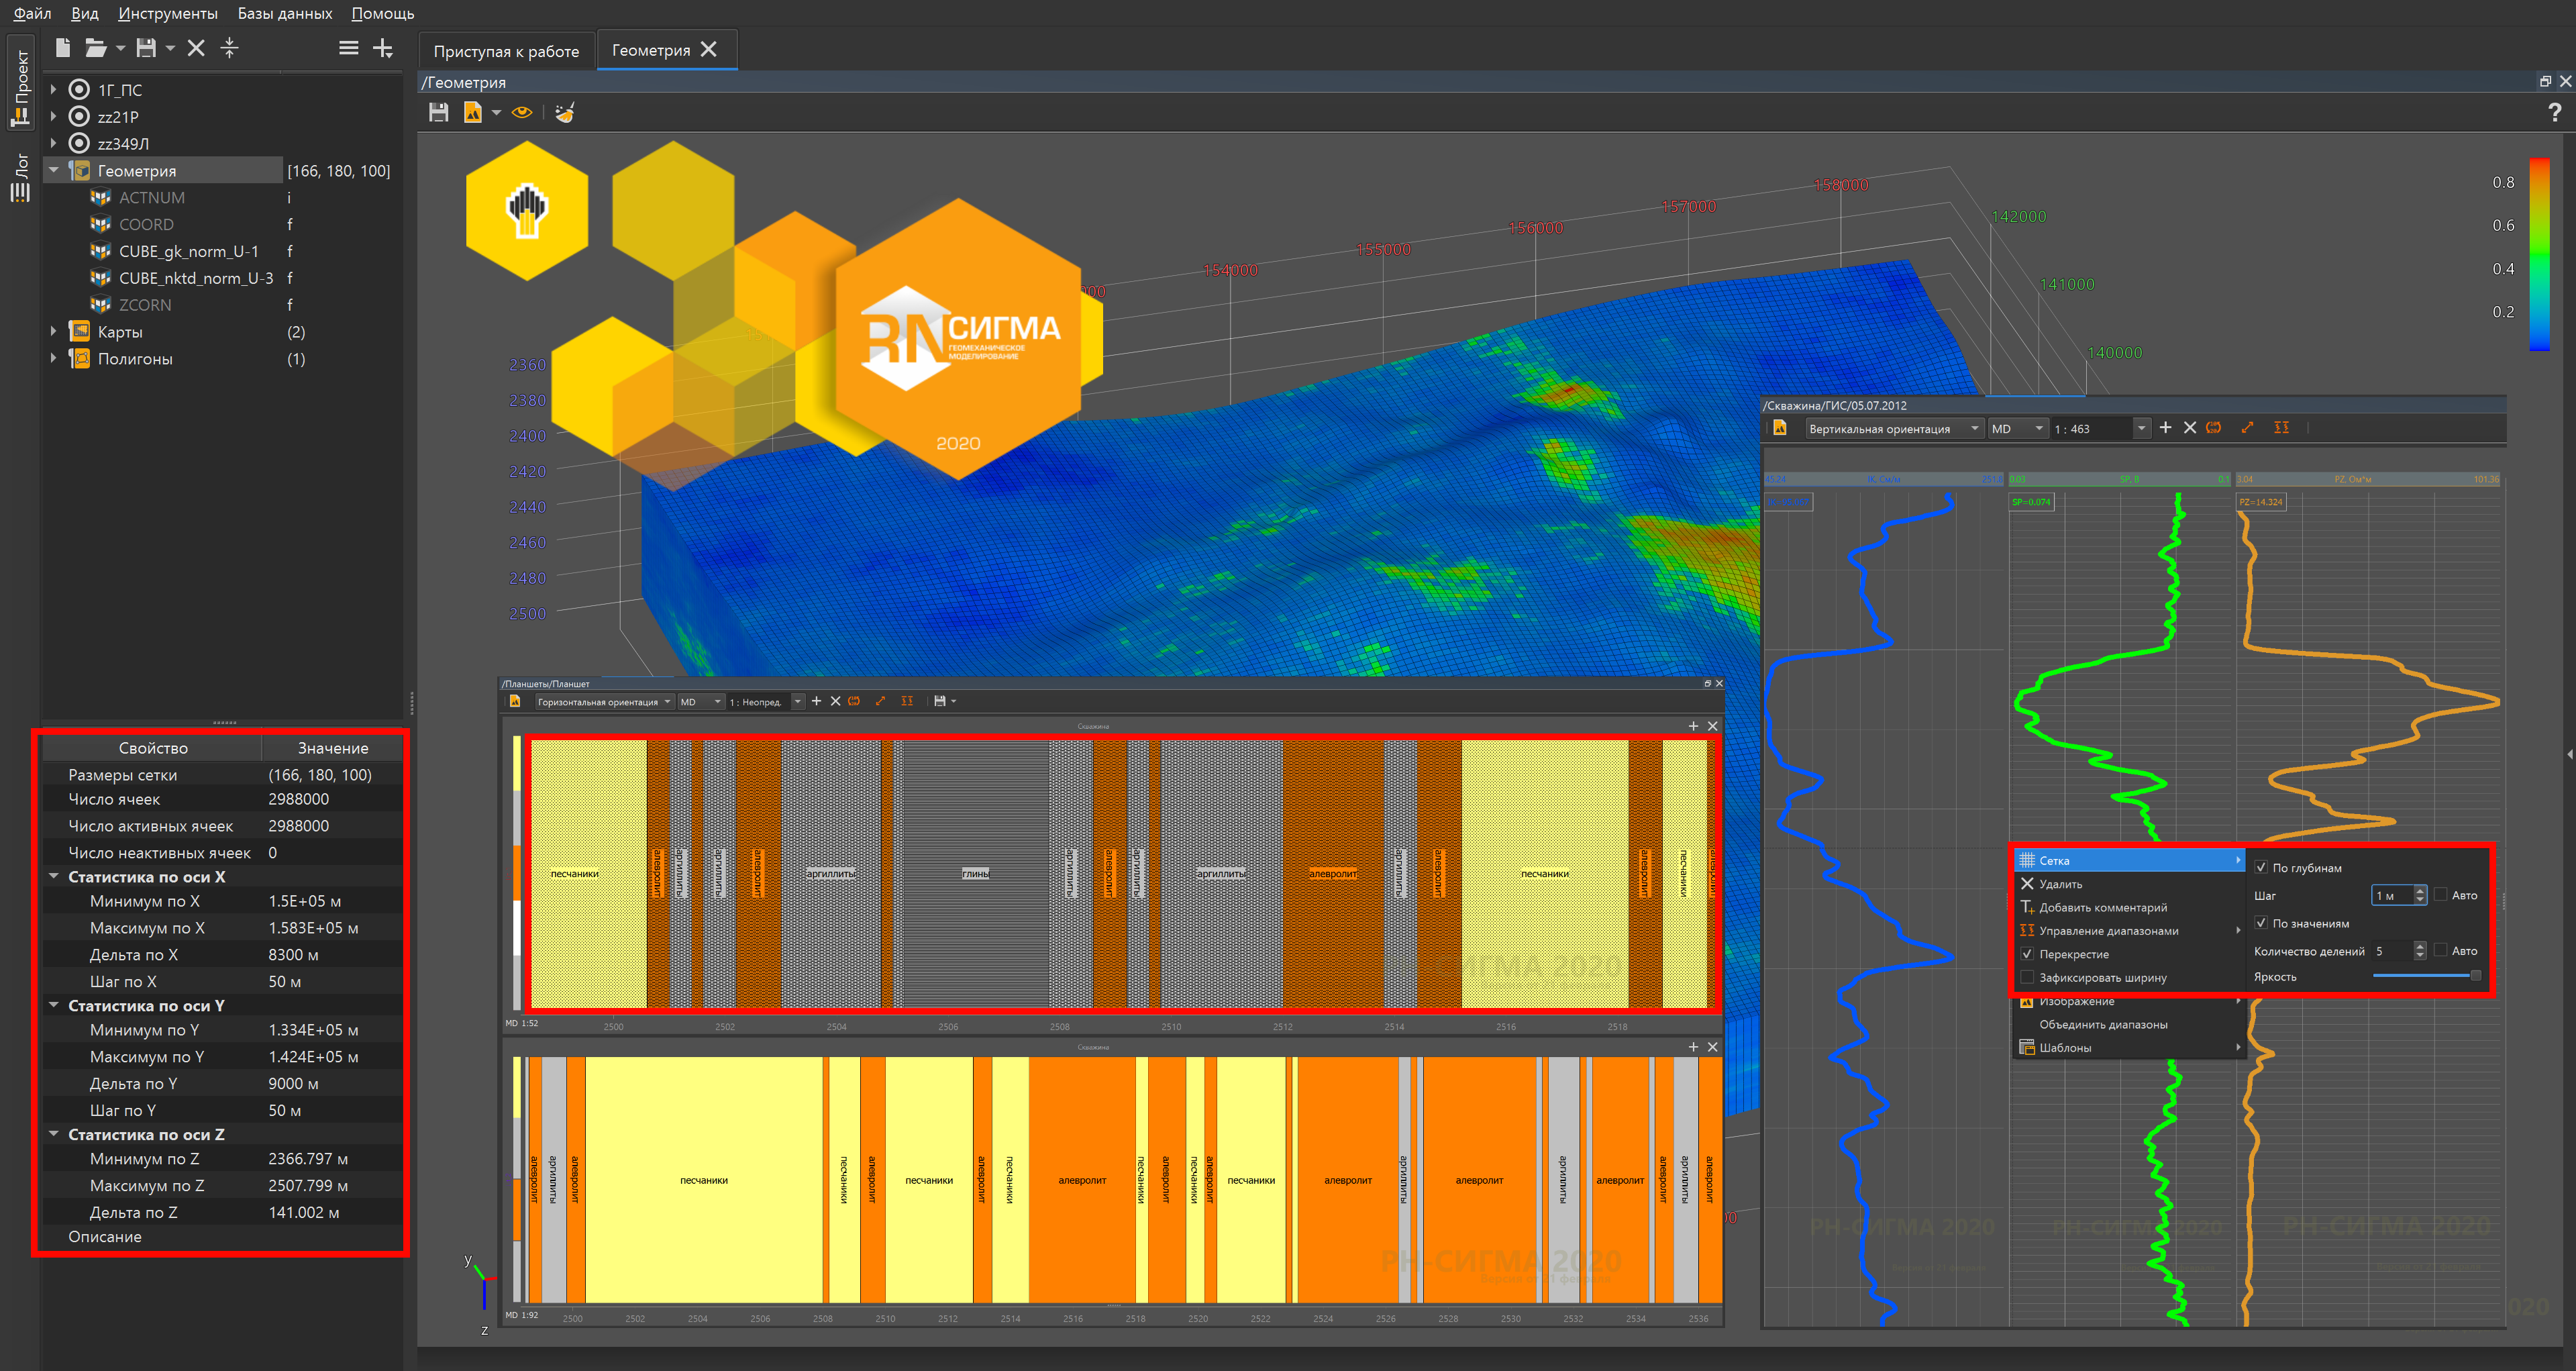
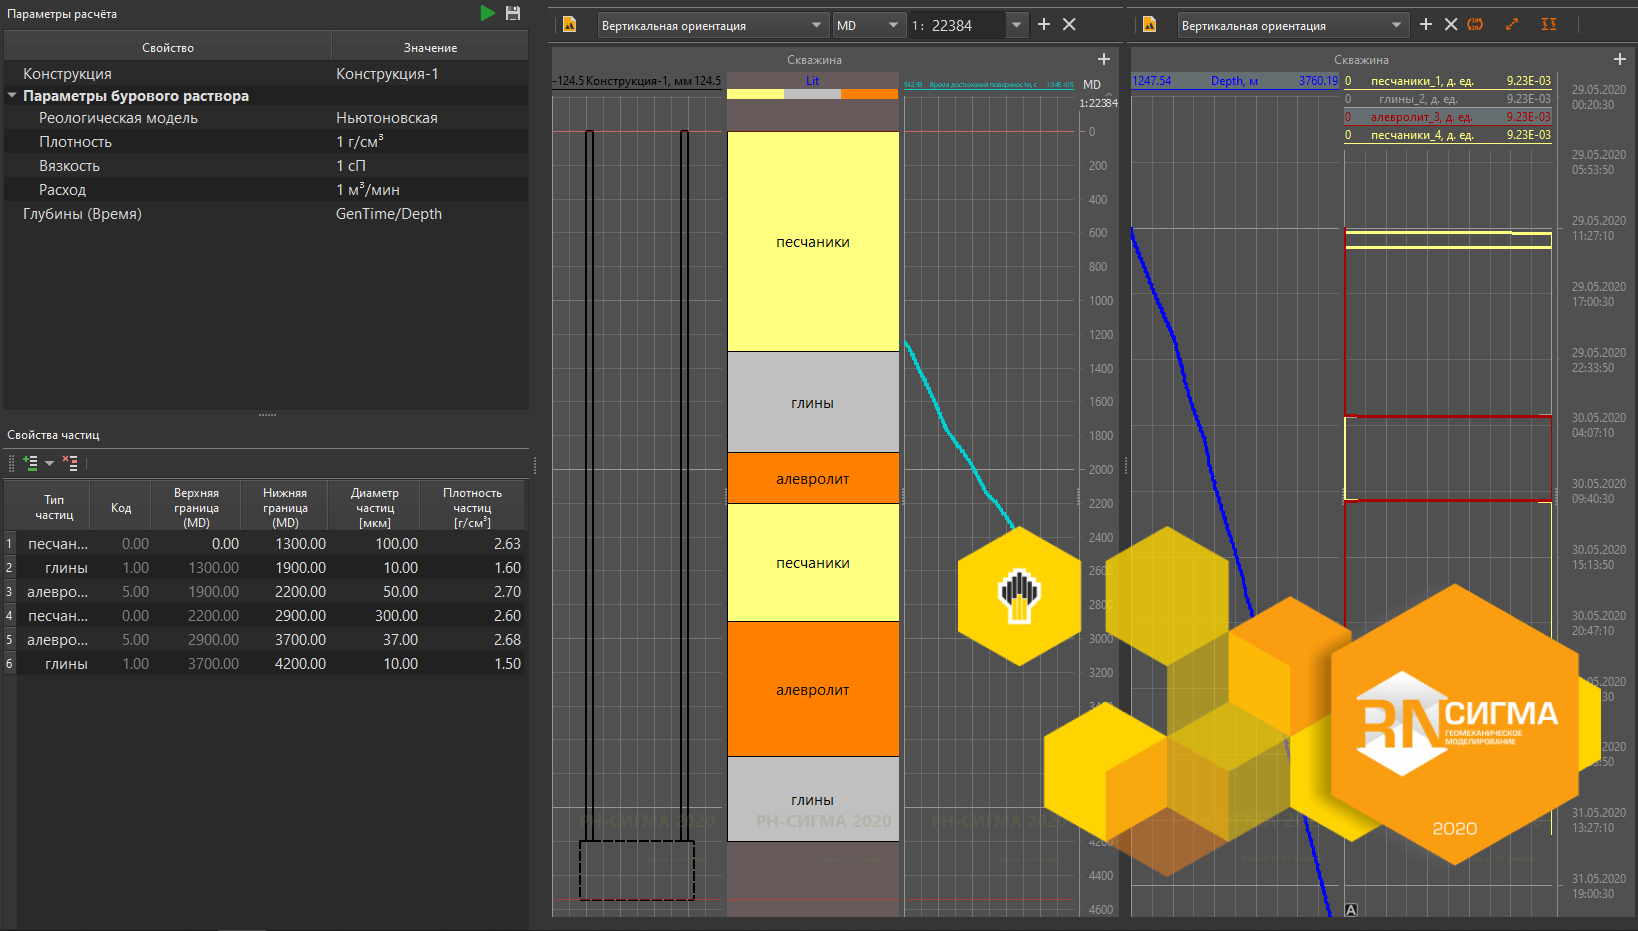
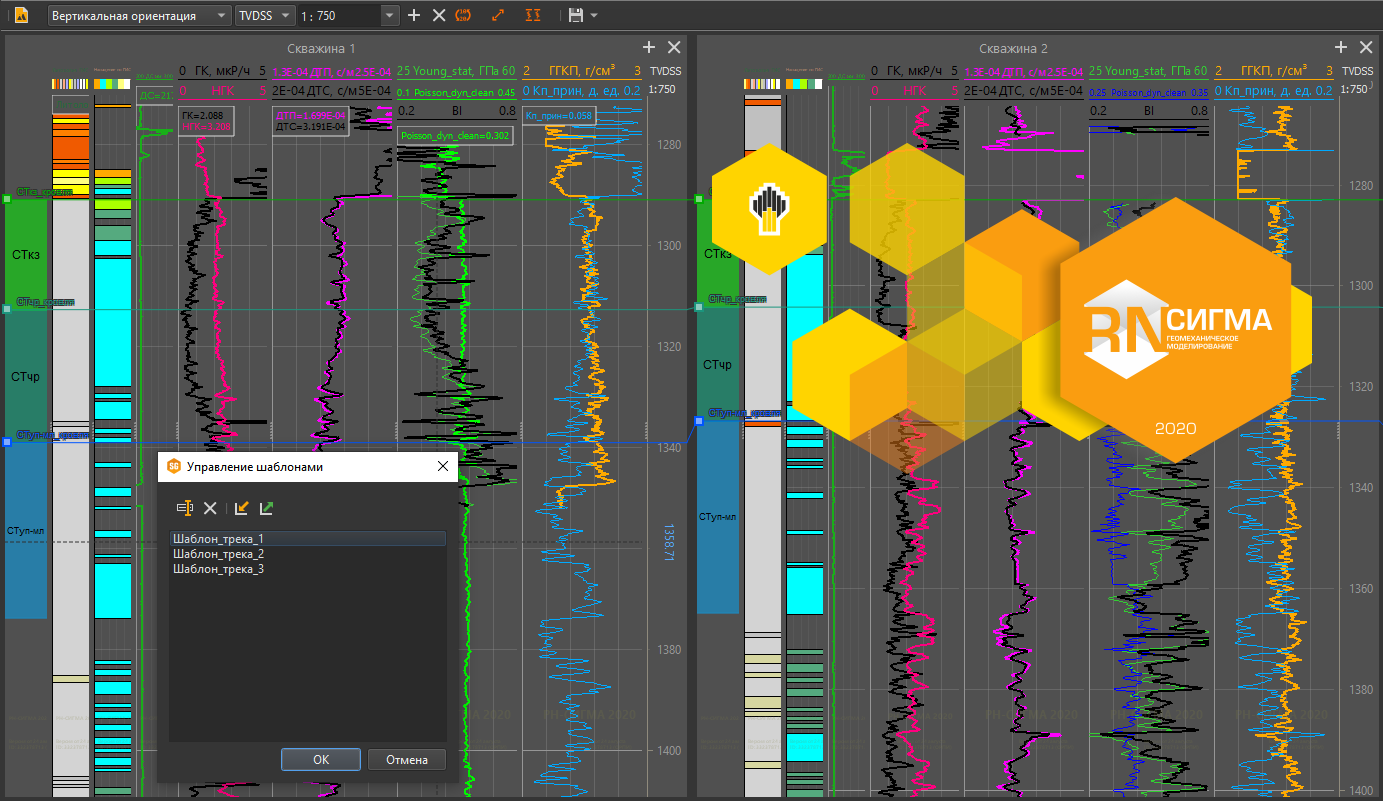
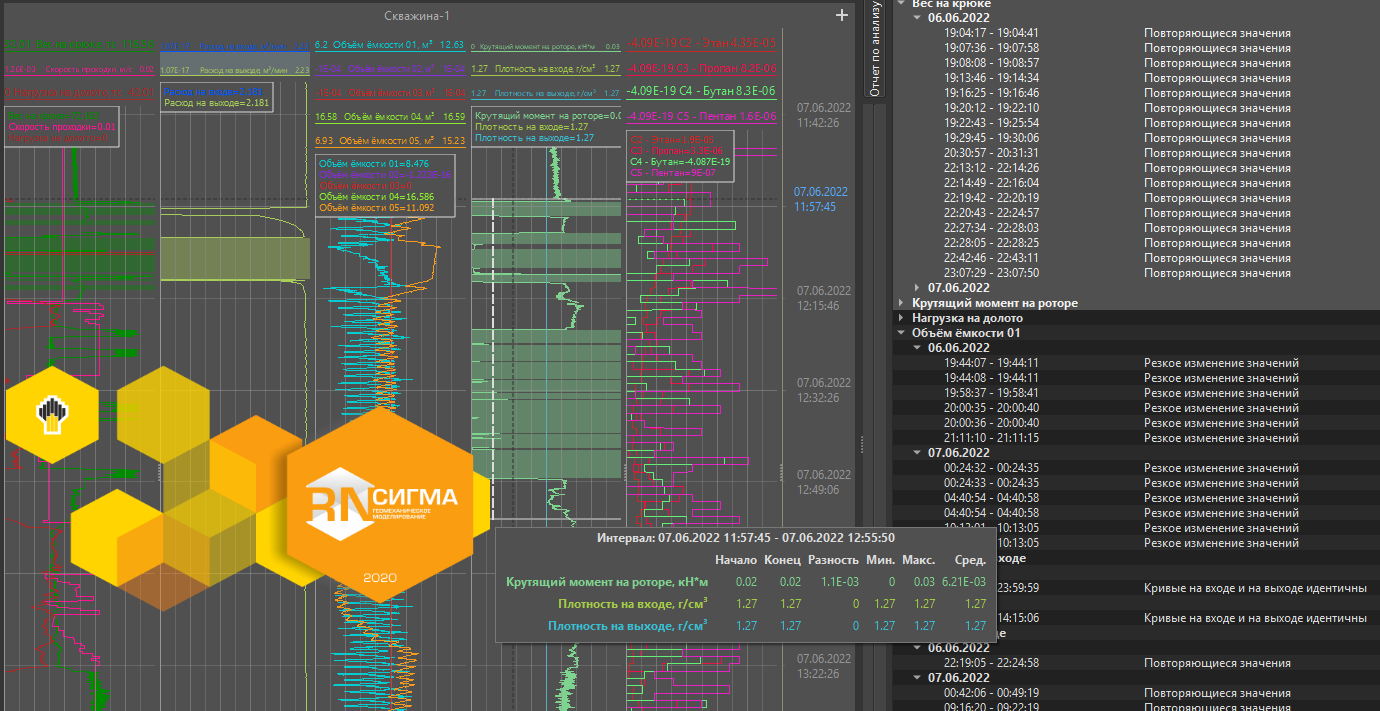
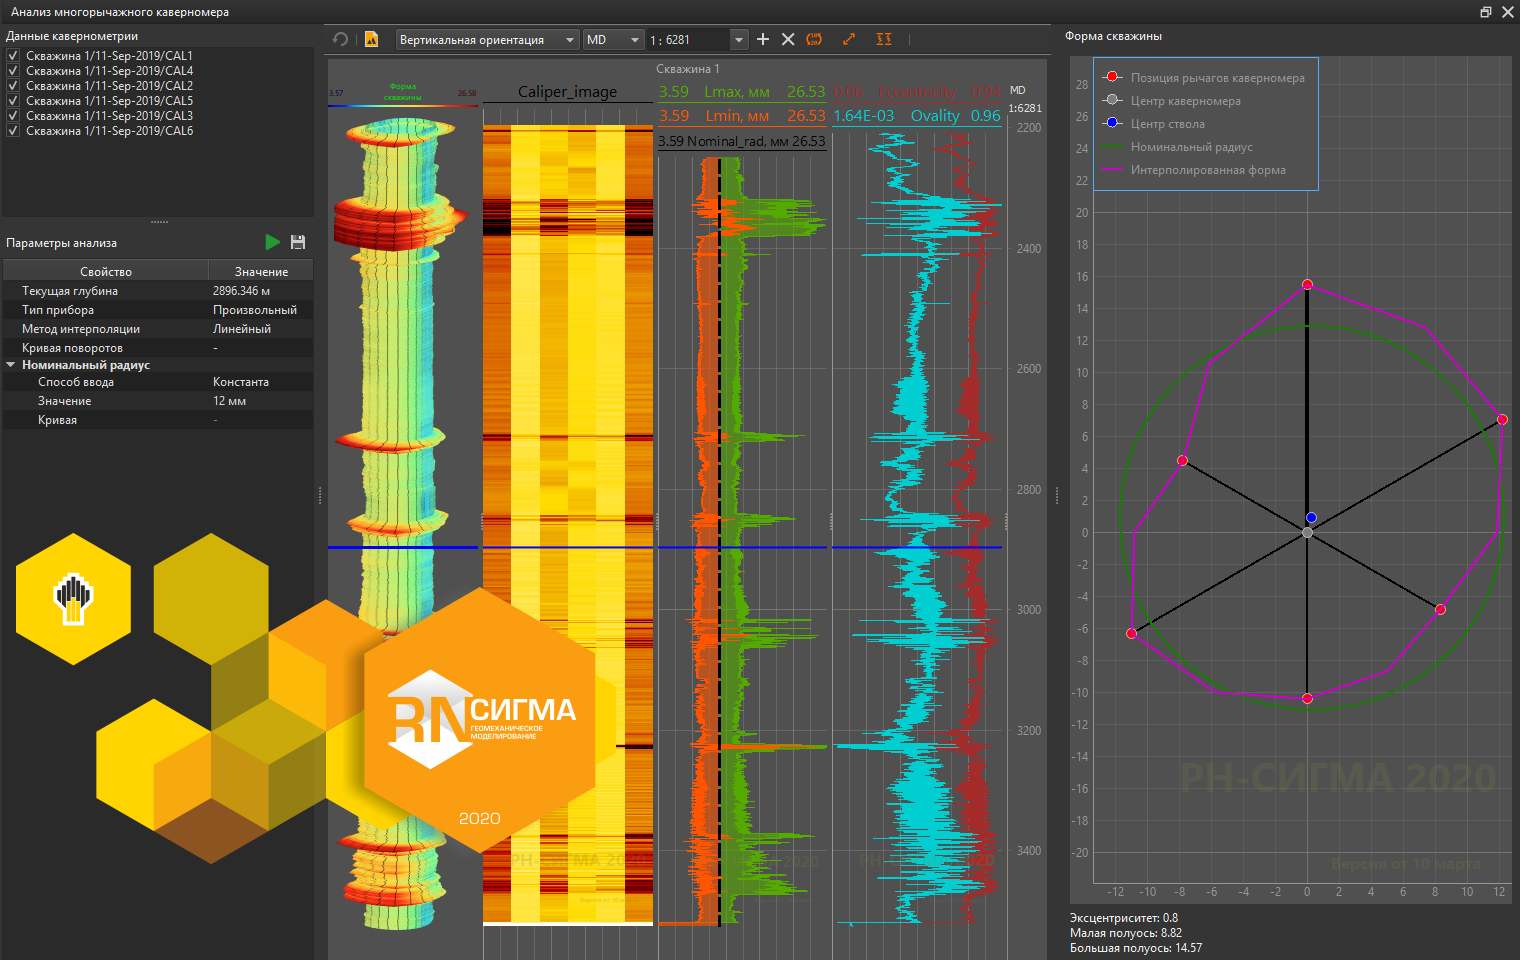
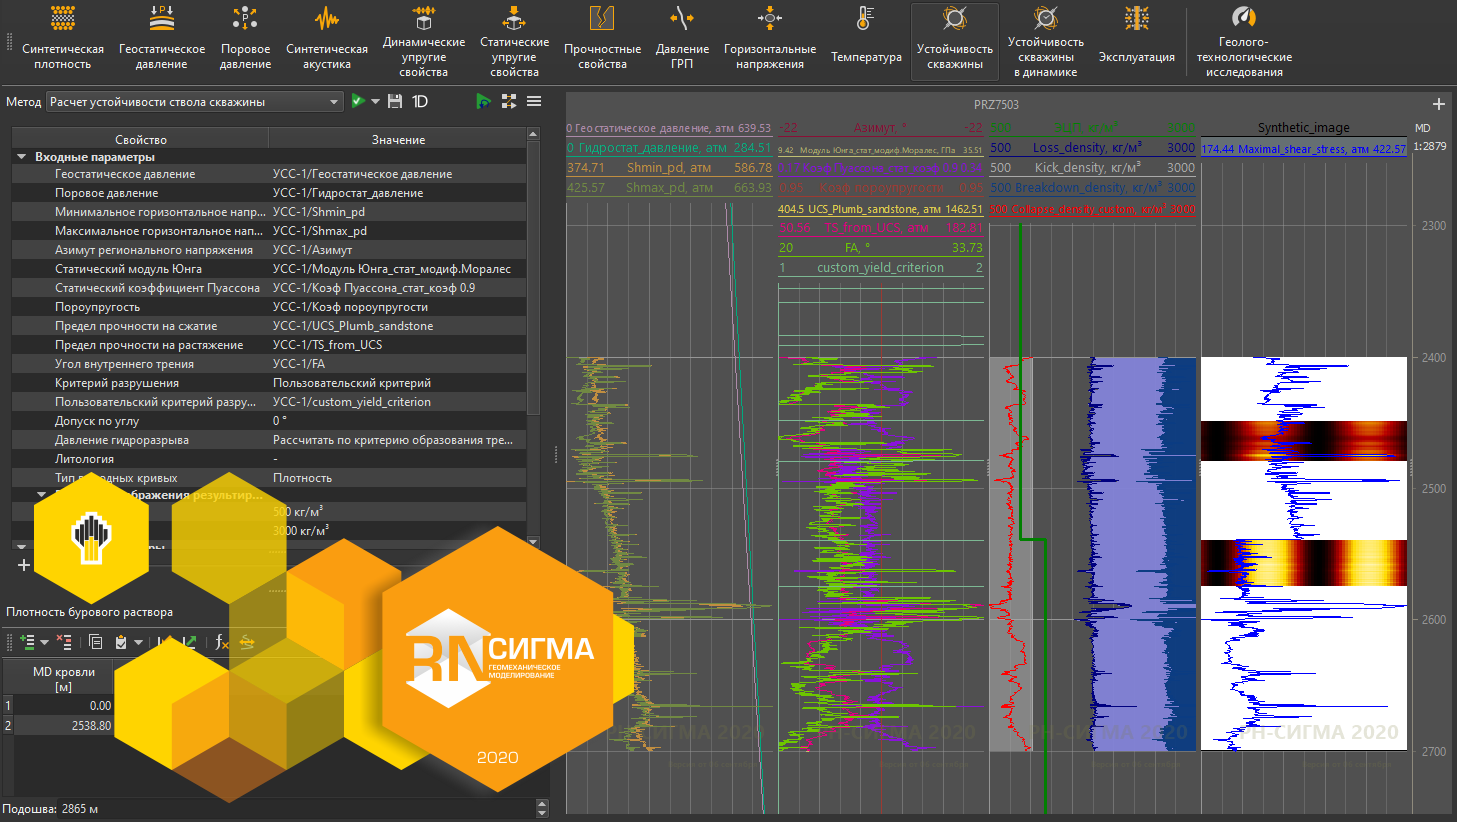
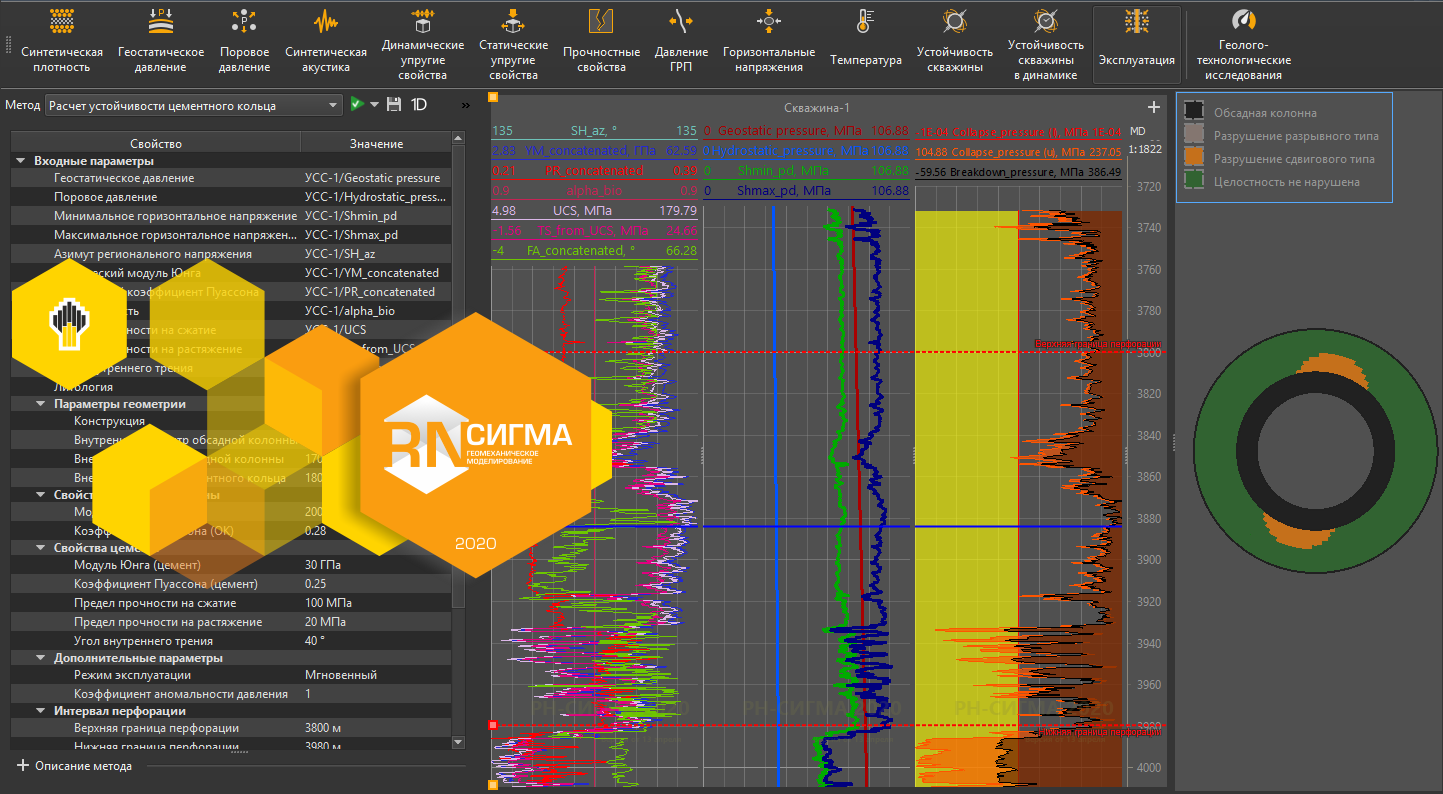
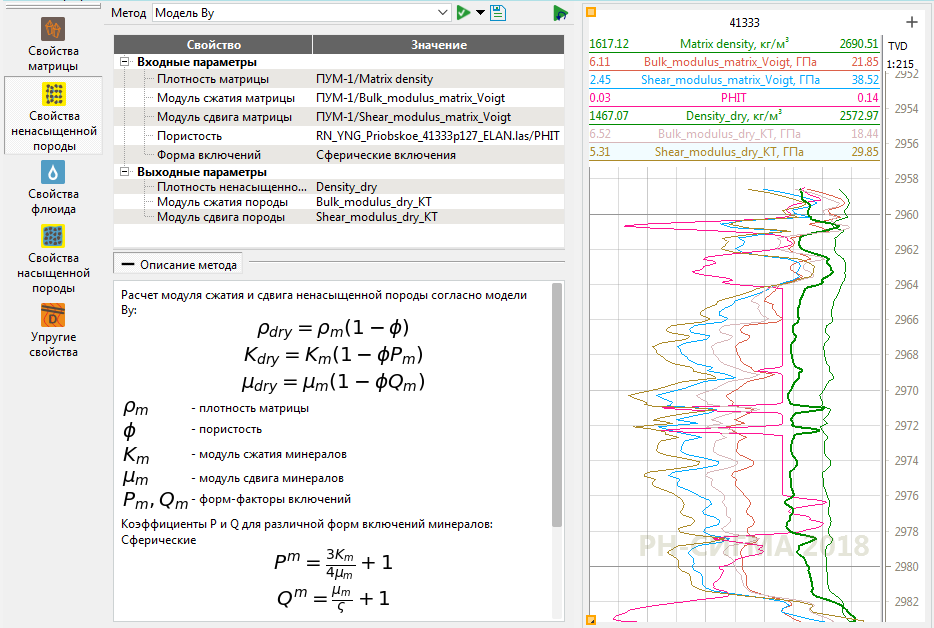
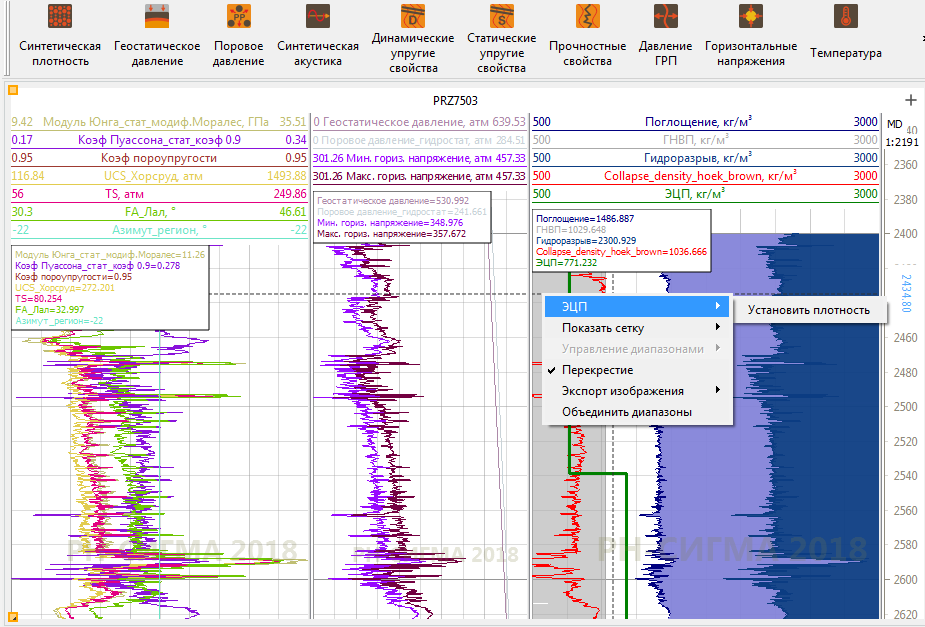
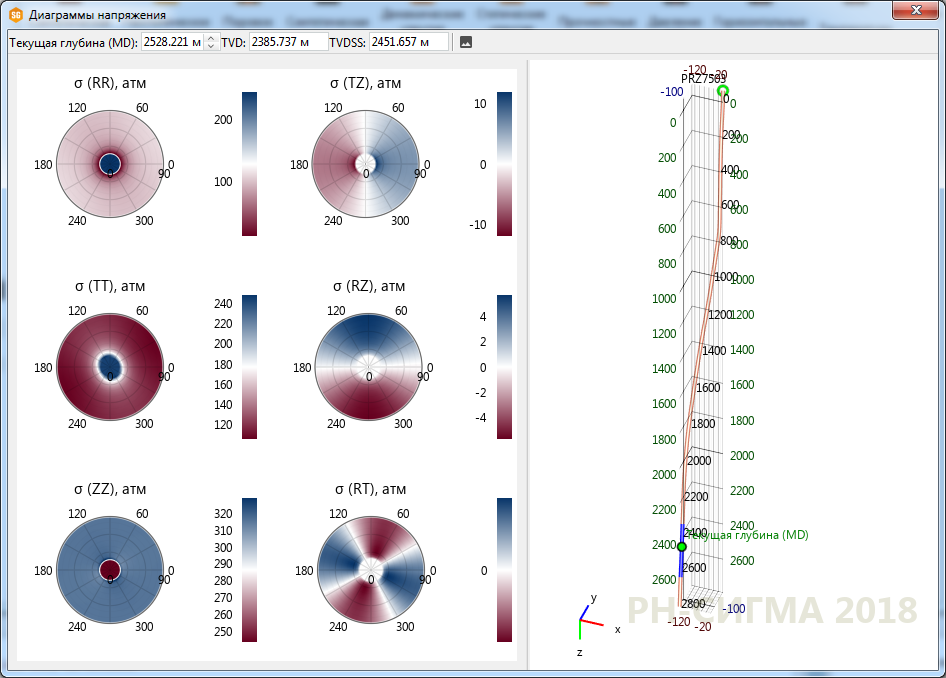
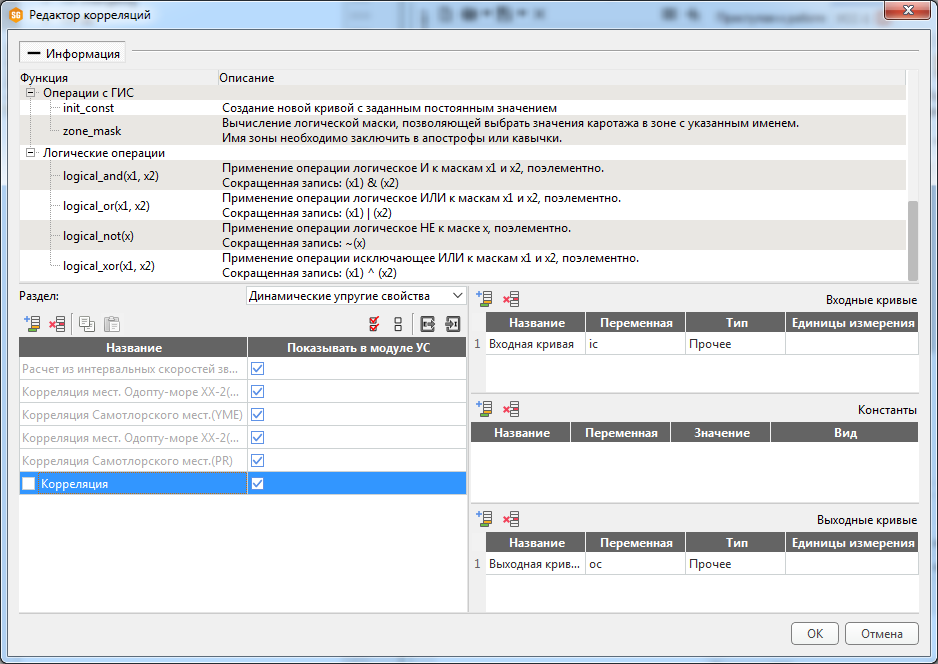
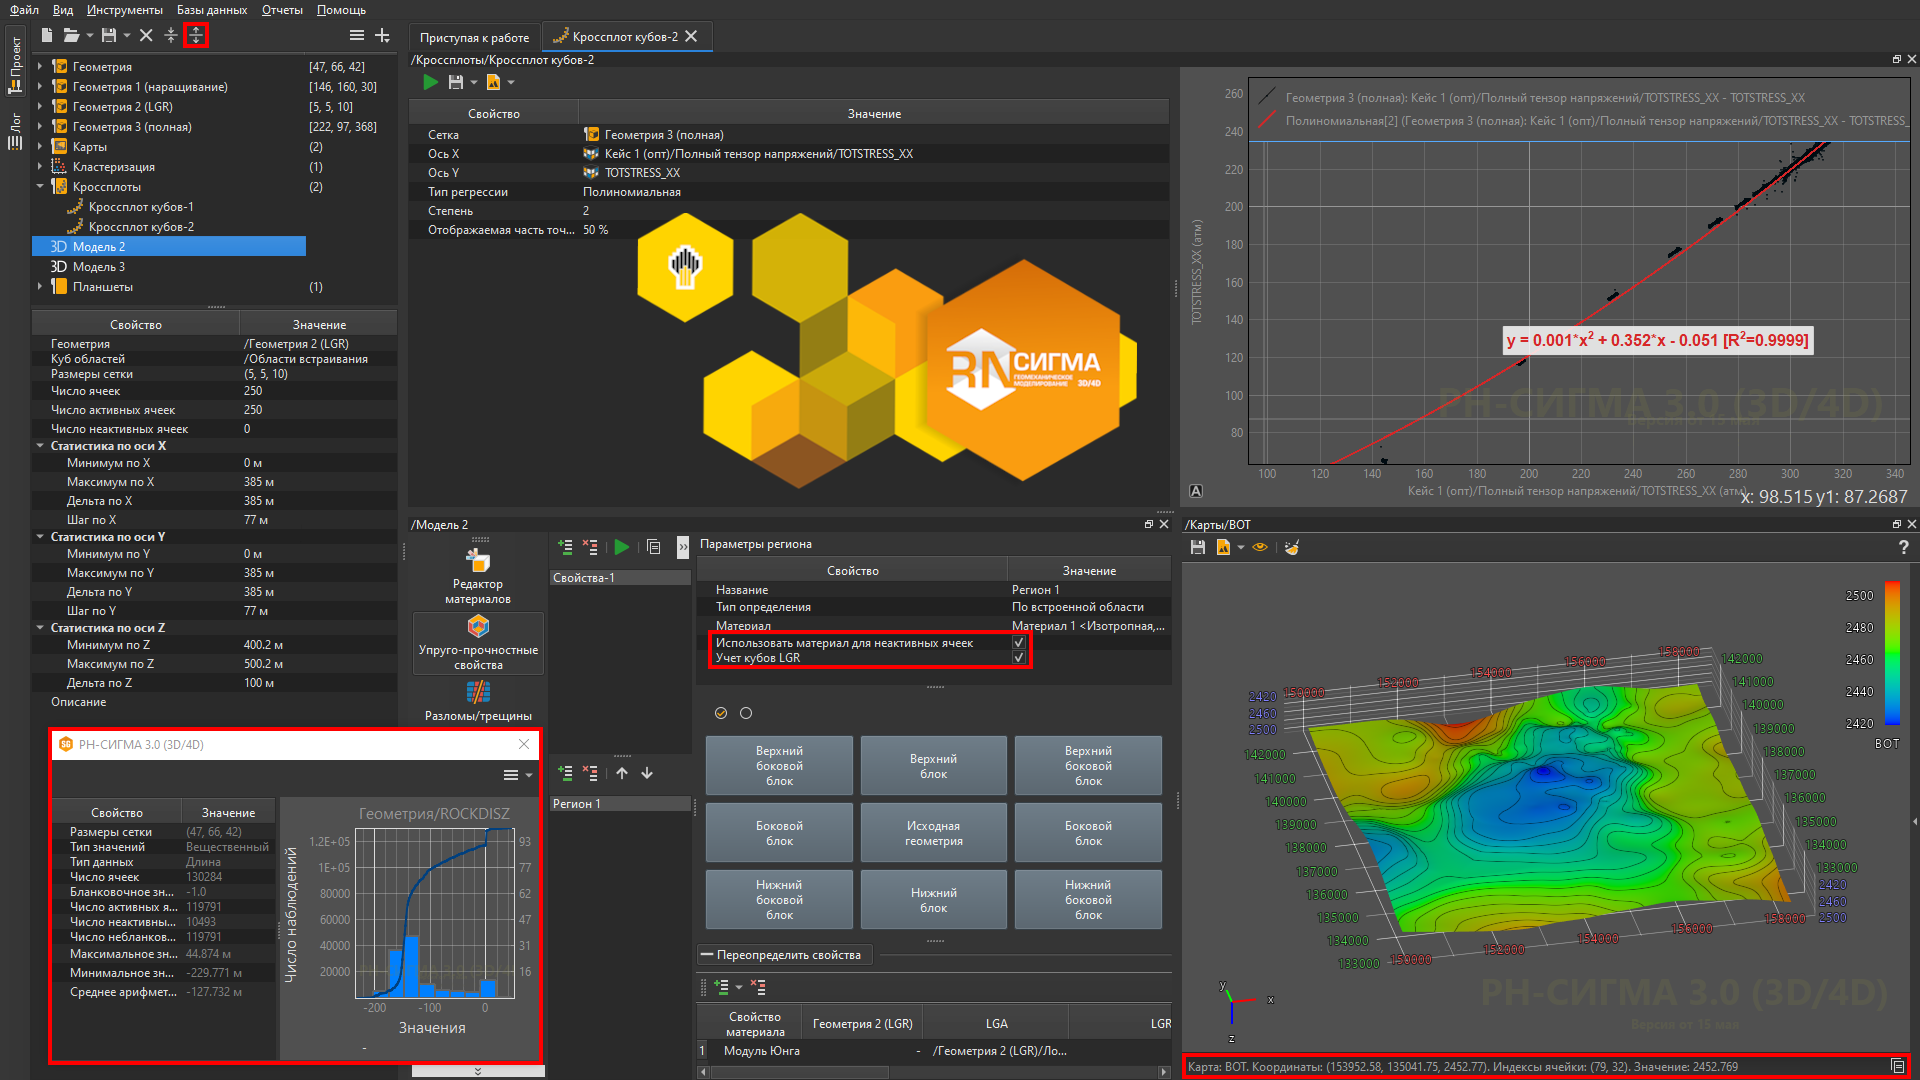
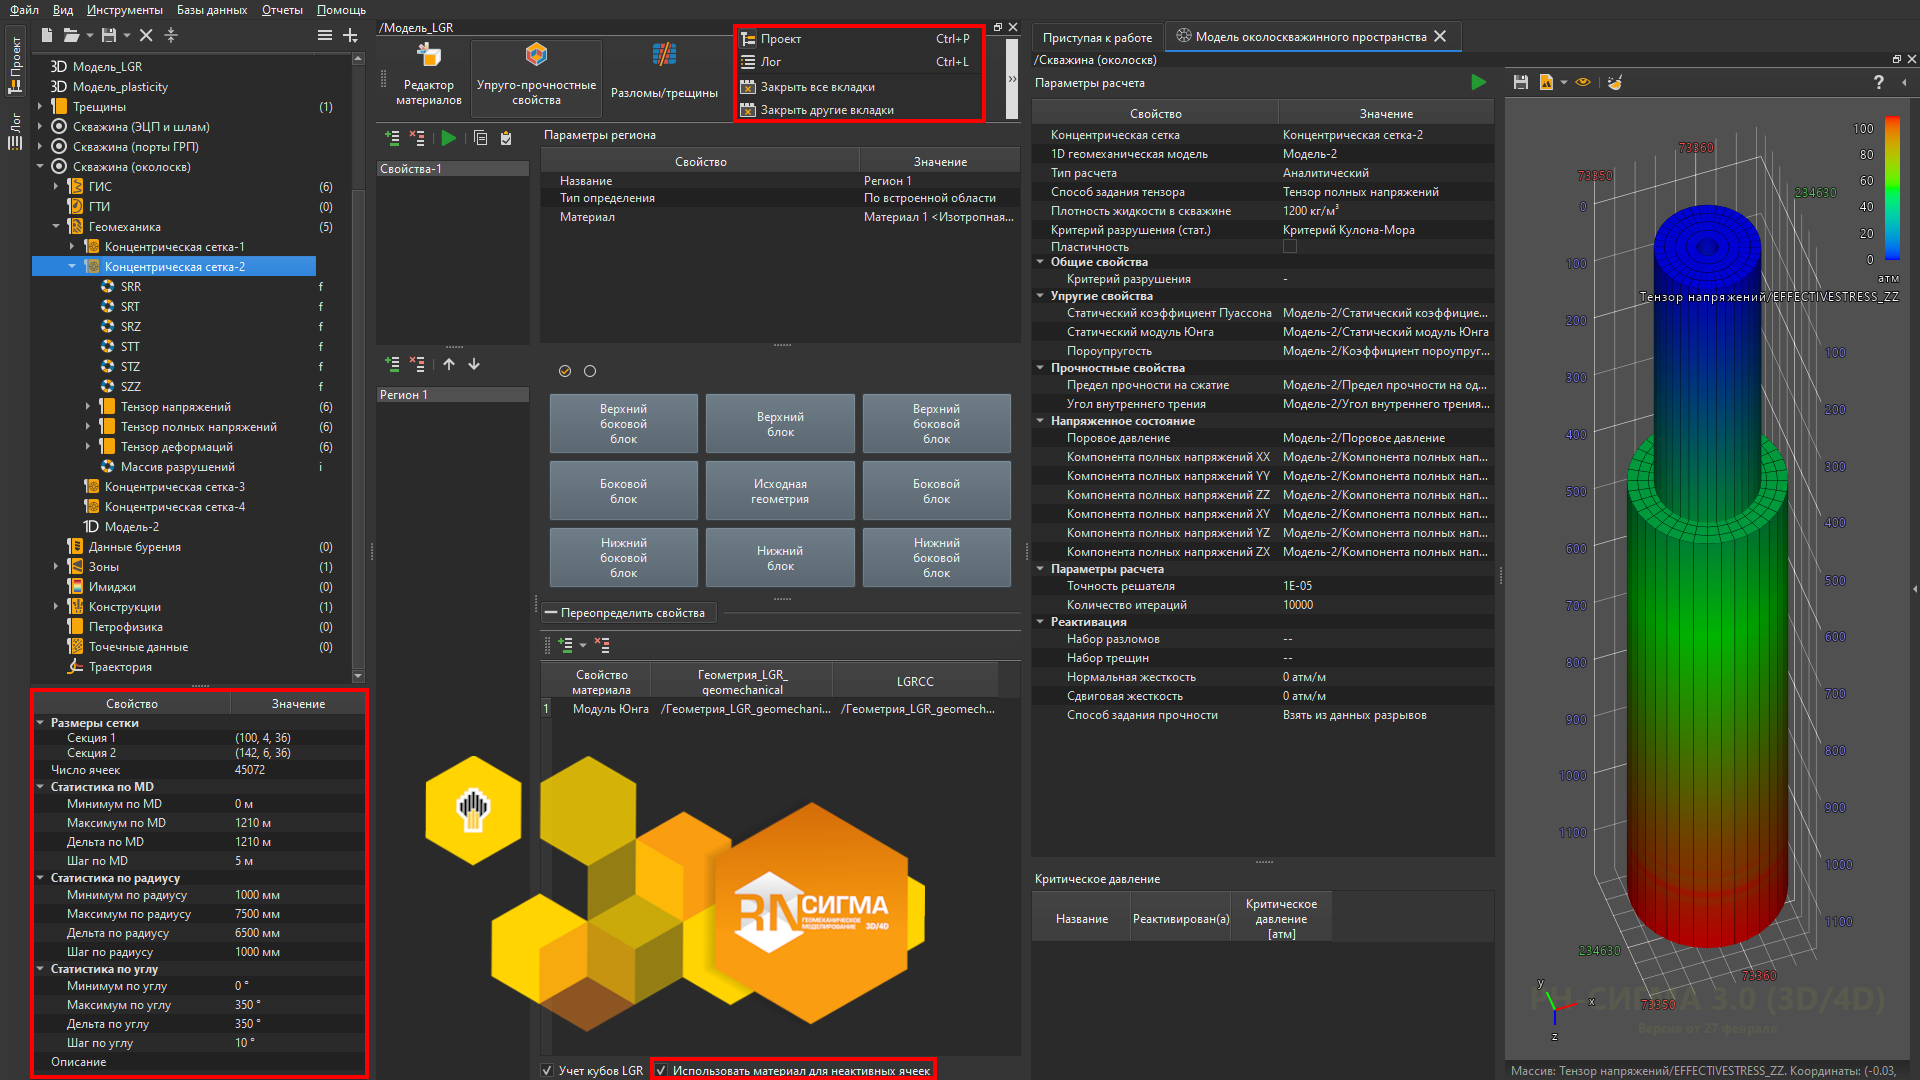
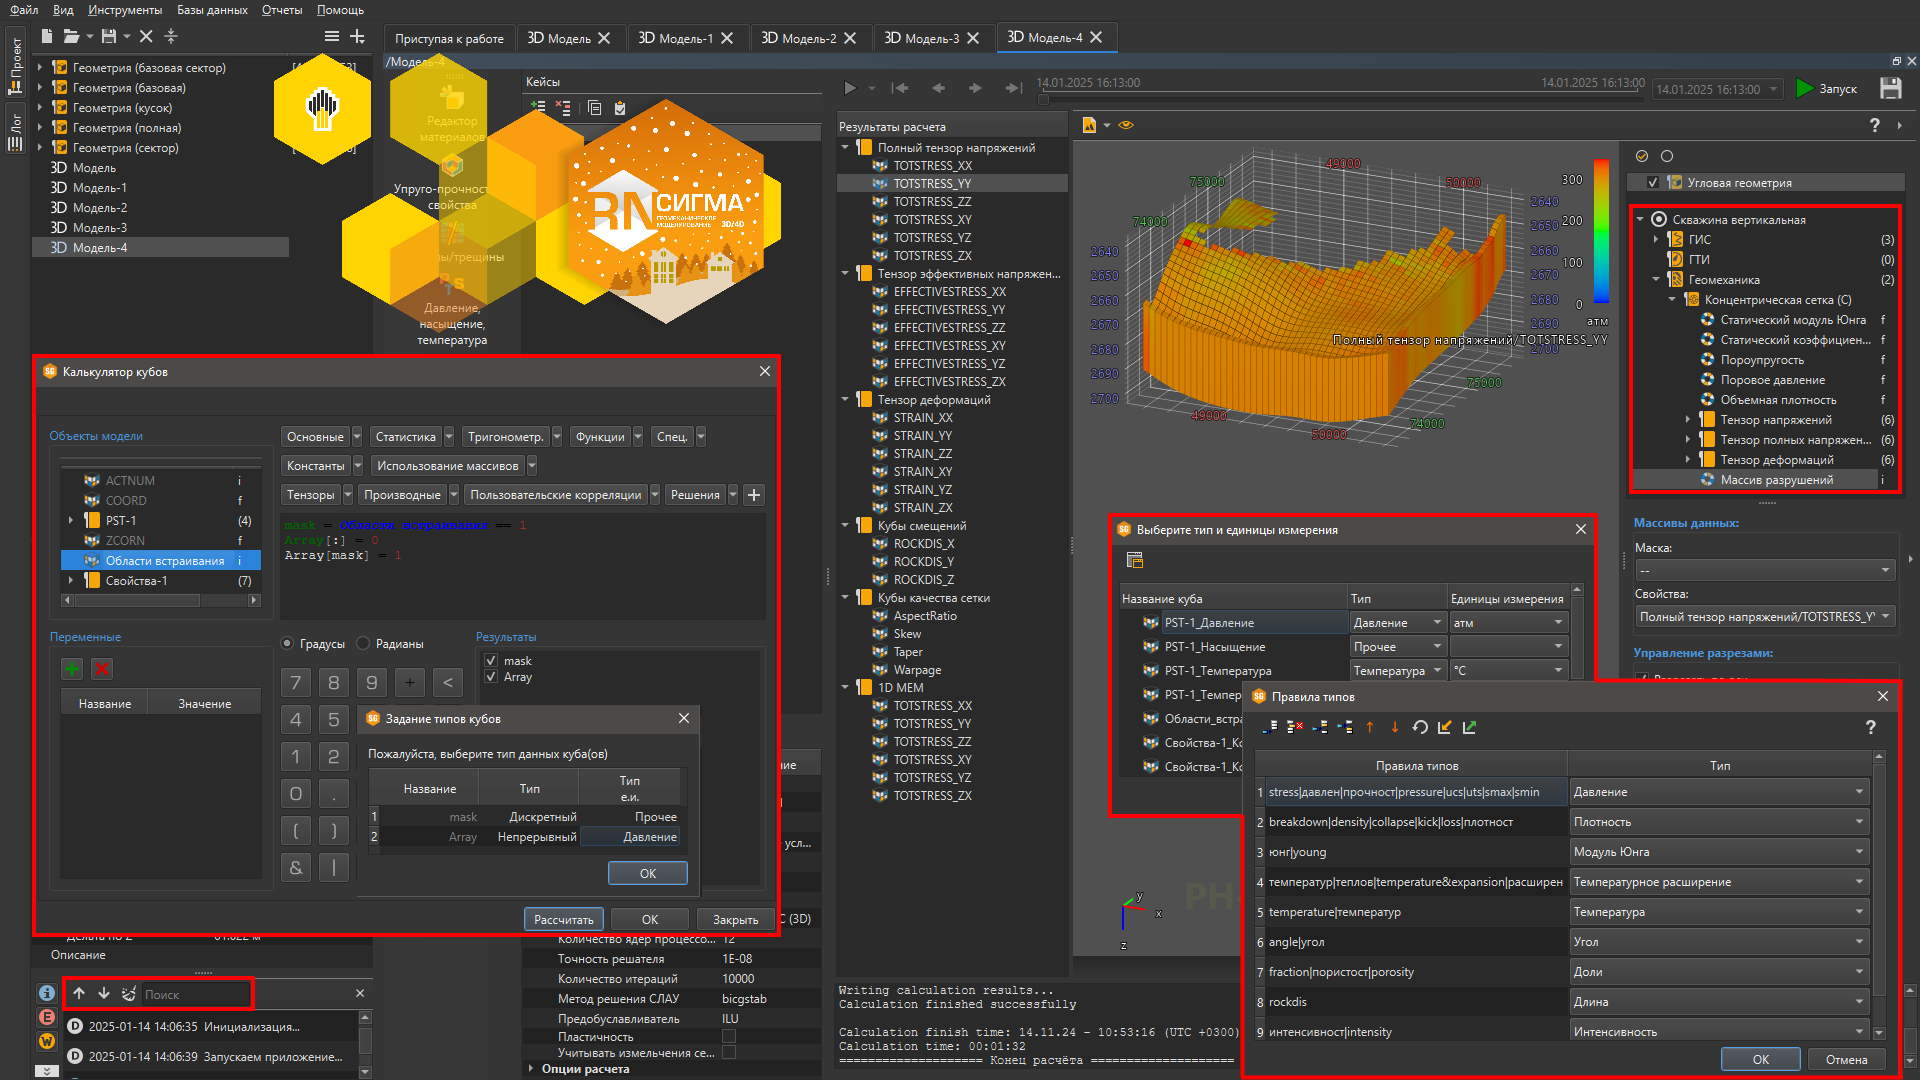
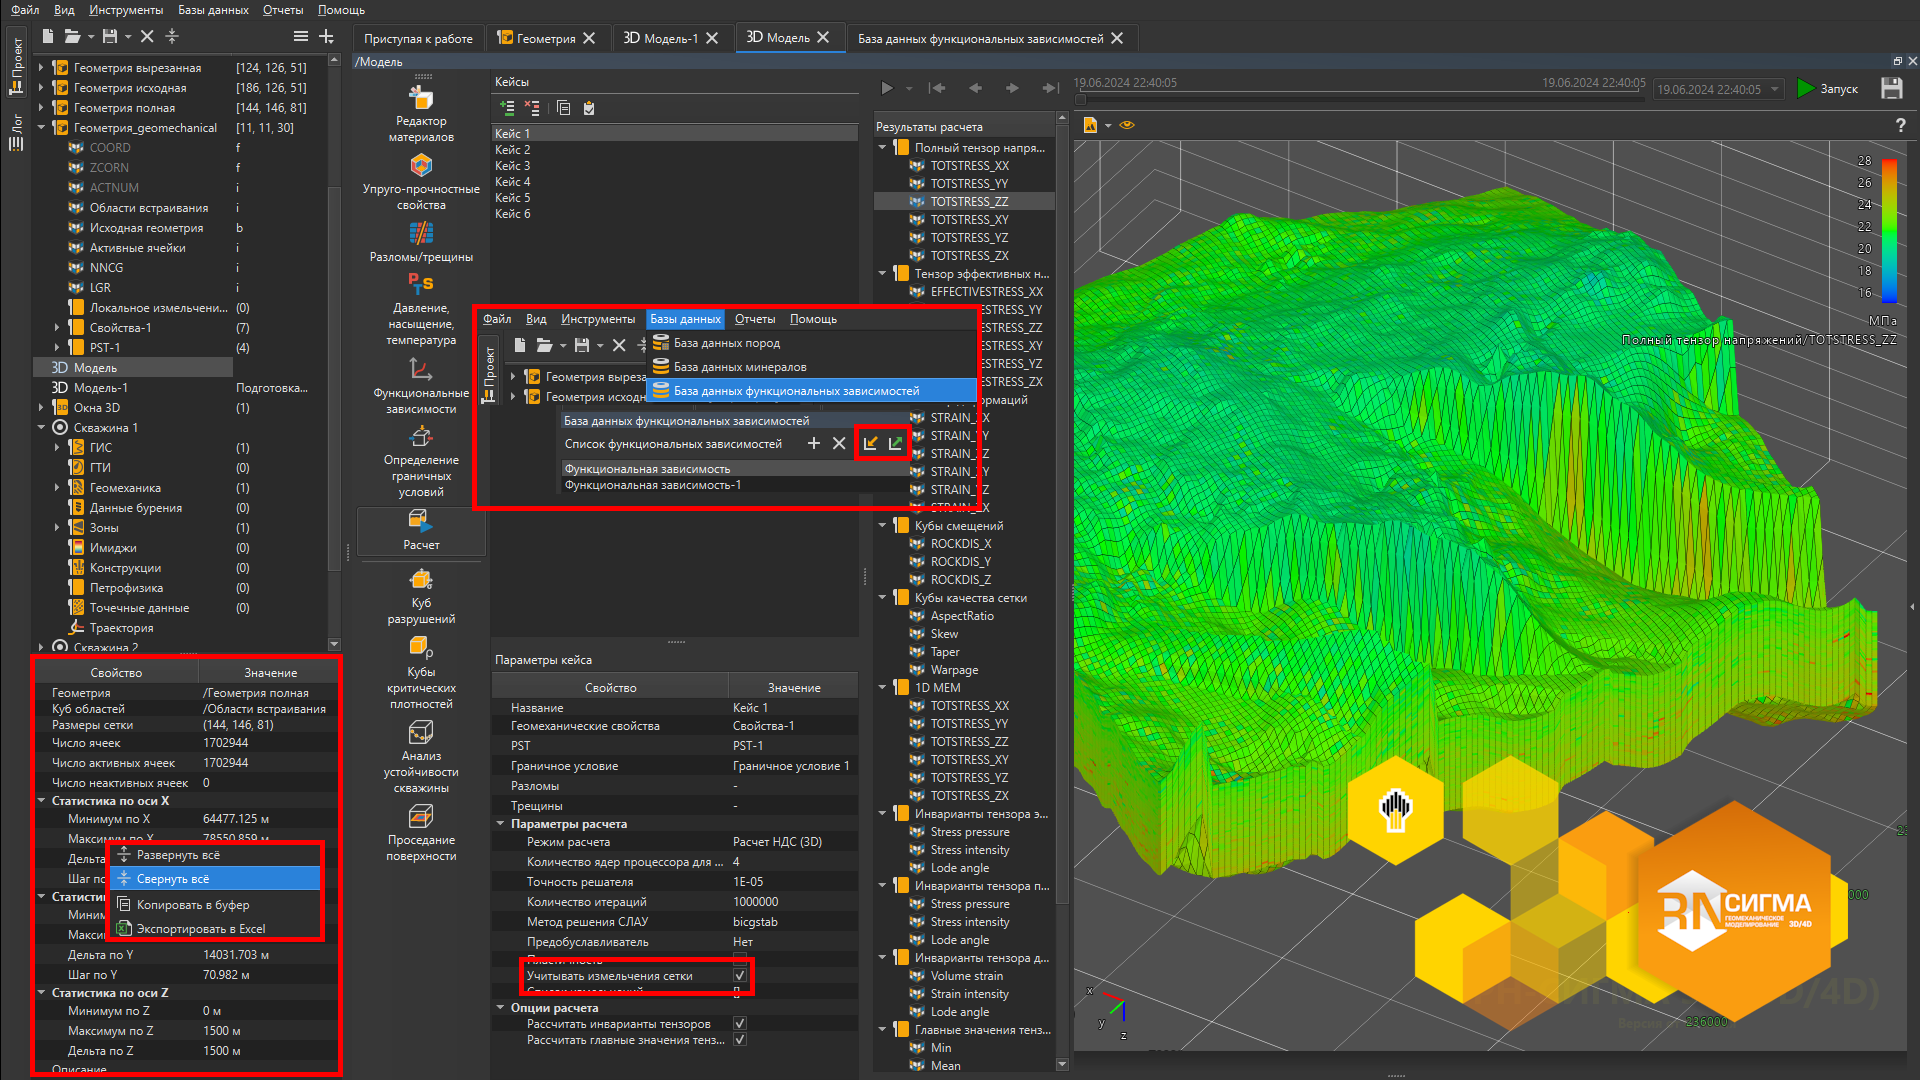
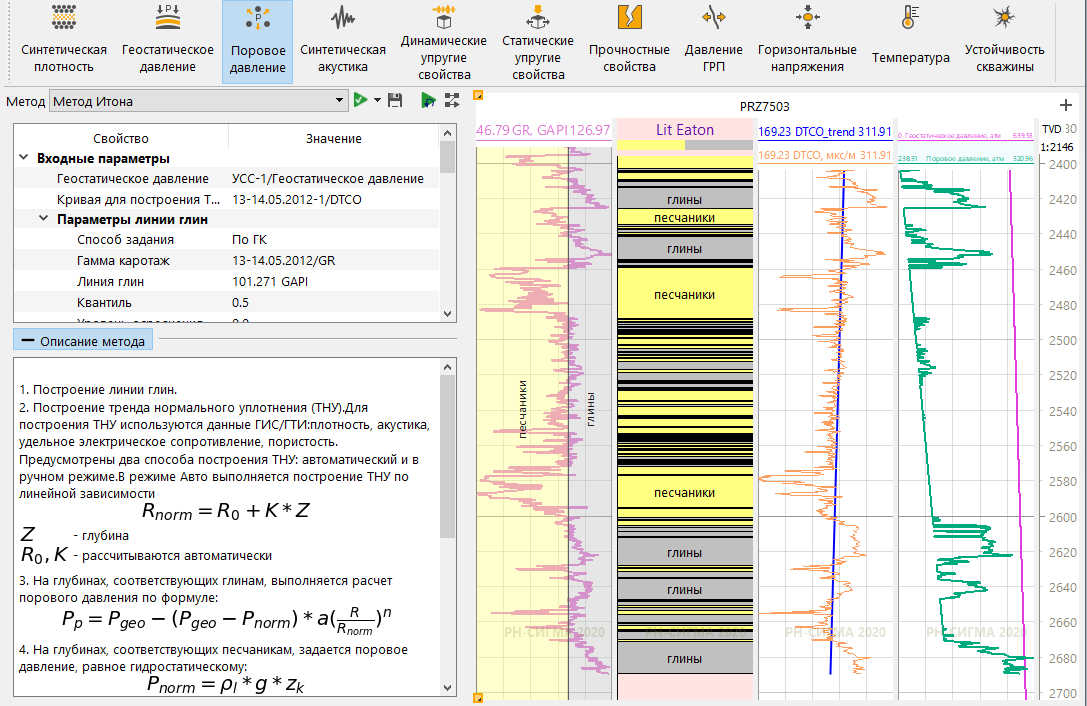
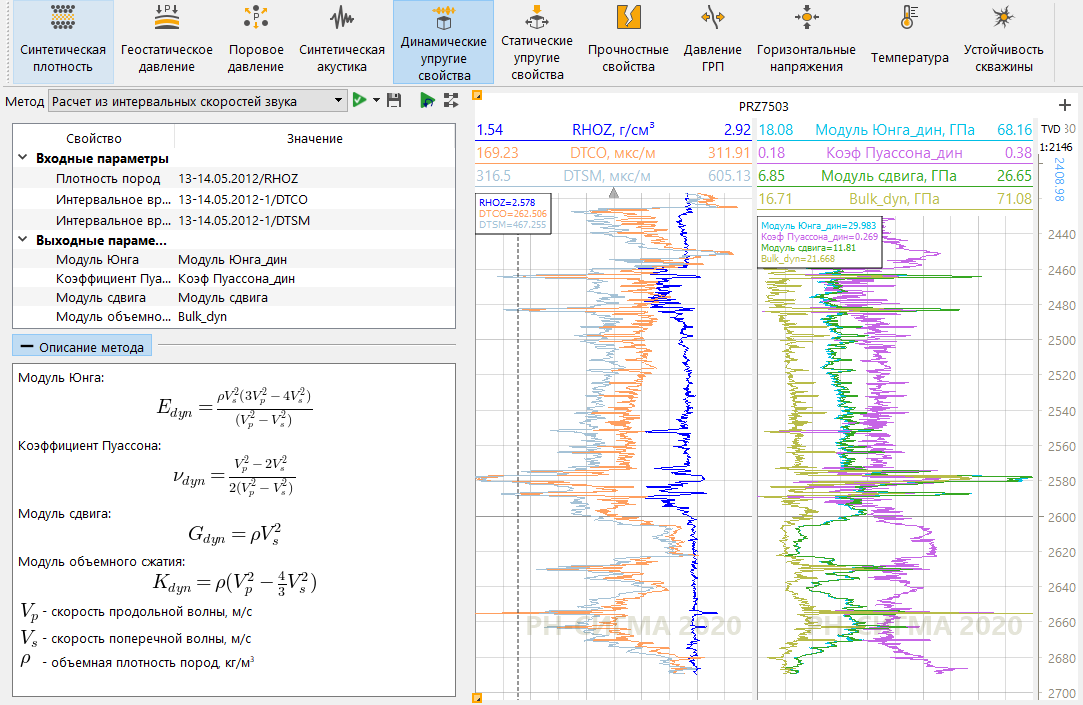
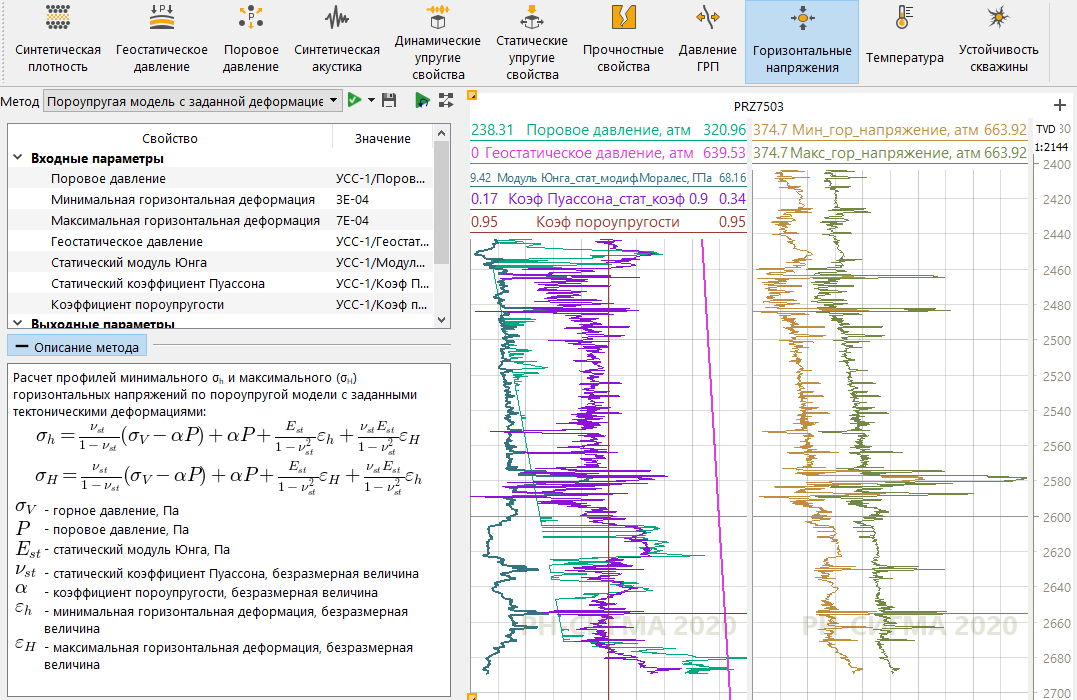
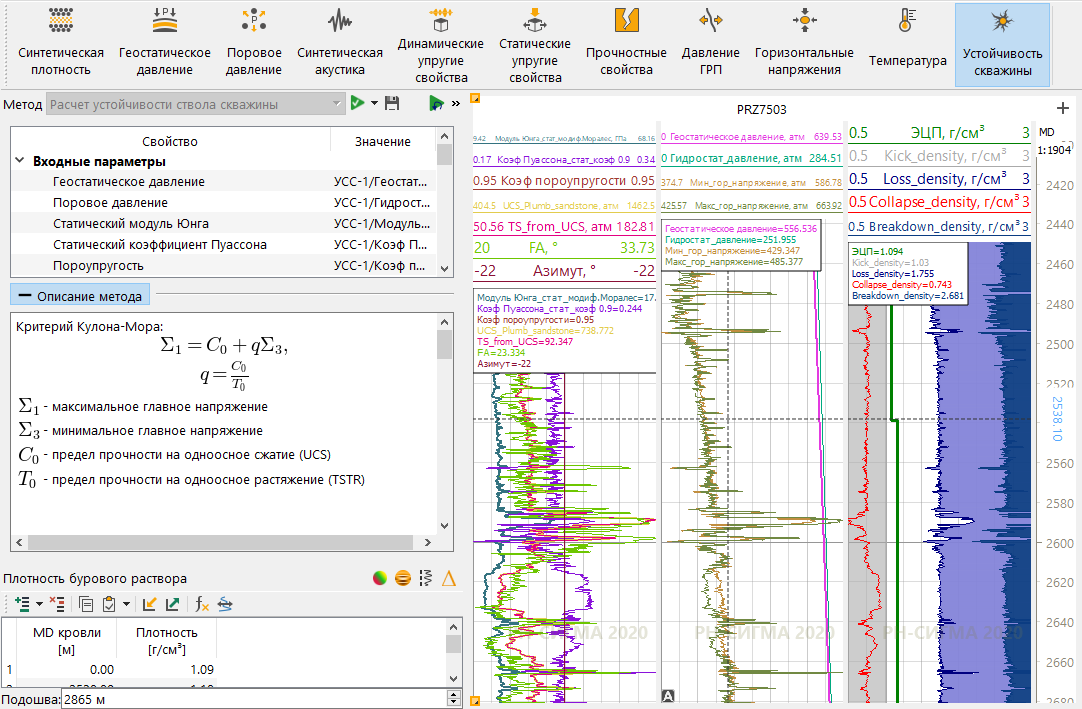
Solving geomechanical problems and wellbore stability analysis for directional and horizontal well drilling. The software helps minimize drilling risks.
Software versions for Windows and Linux are availableInformation on the software price and purchase conditions will be provided upon requestListed in the Unified Register of Russian Programs for Electronic Computers and Databases