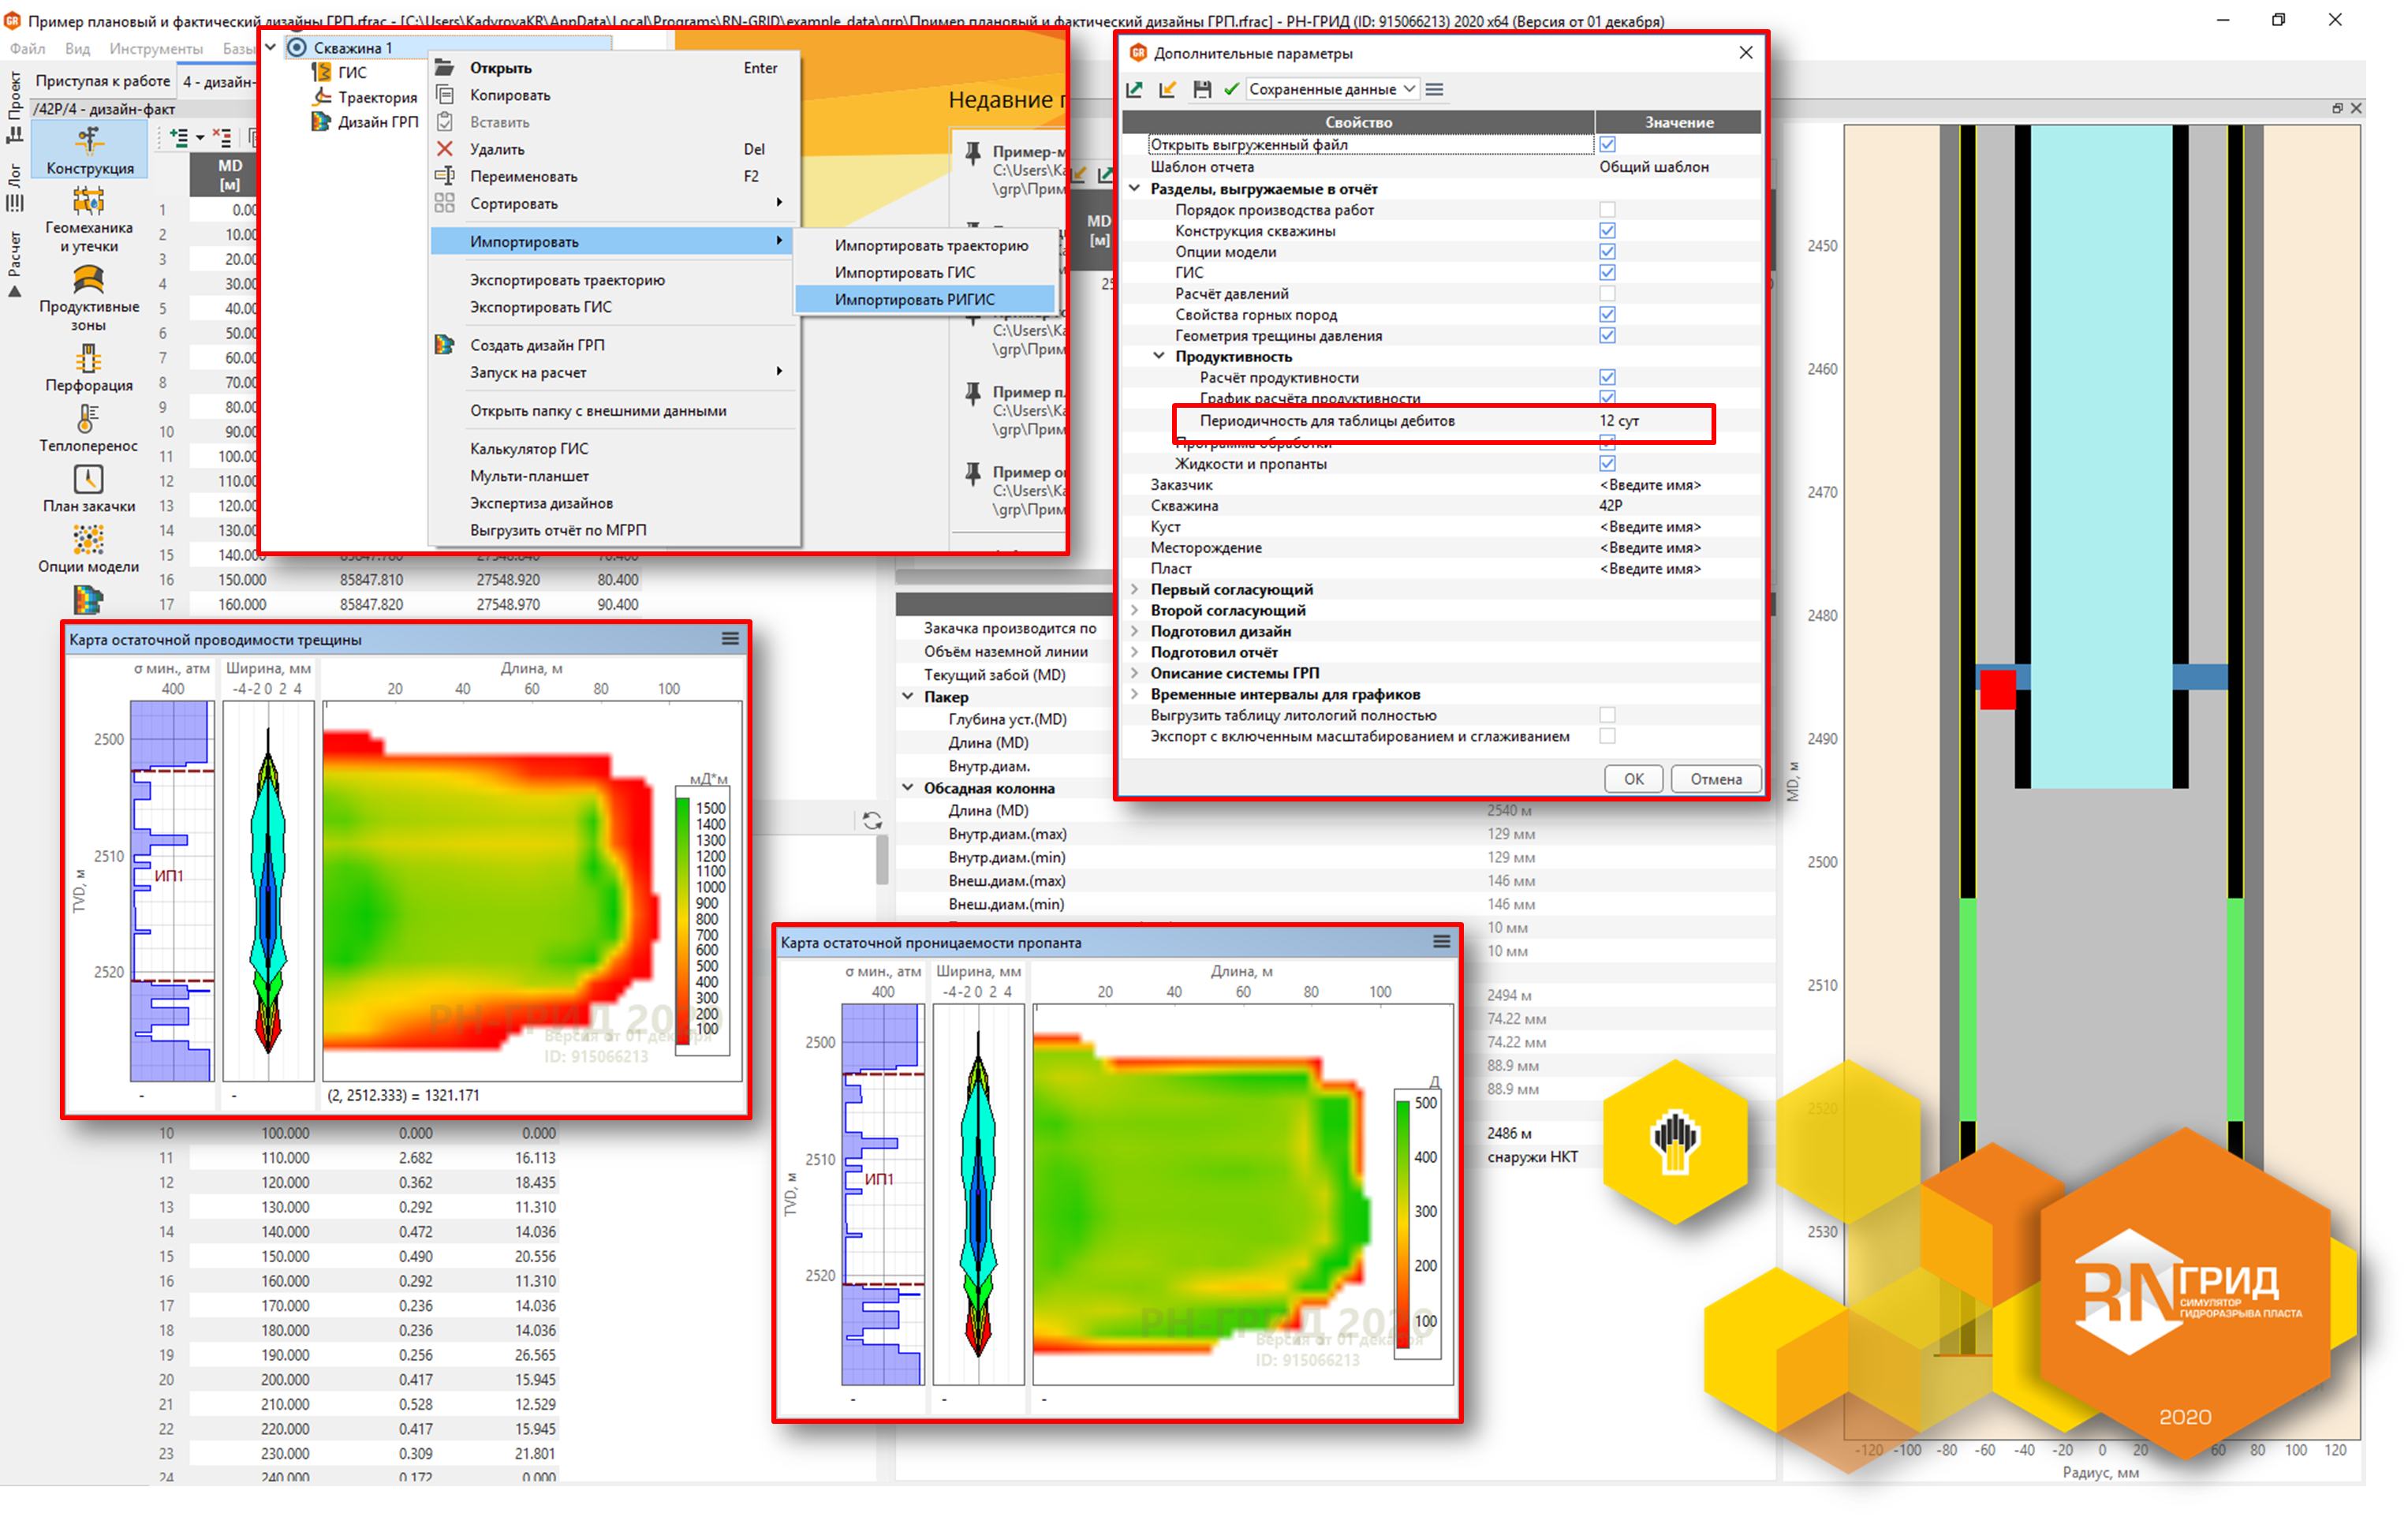
More than half of global oil production comes from fractured wells. Fracturing technology is especially relevant for low permeability (including shale) reservoirs. The method consists in creating a highly conductive channel (fracture) in the target formation to provide the flow of reservour fluid (gas, oil) to the well.
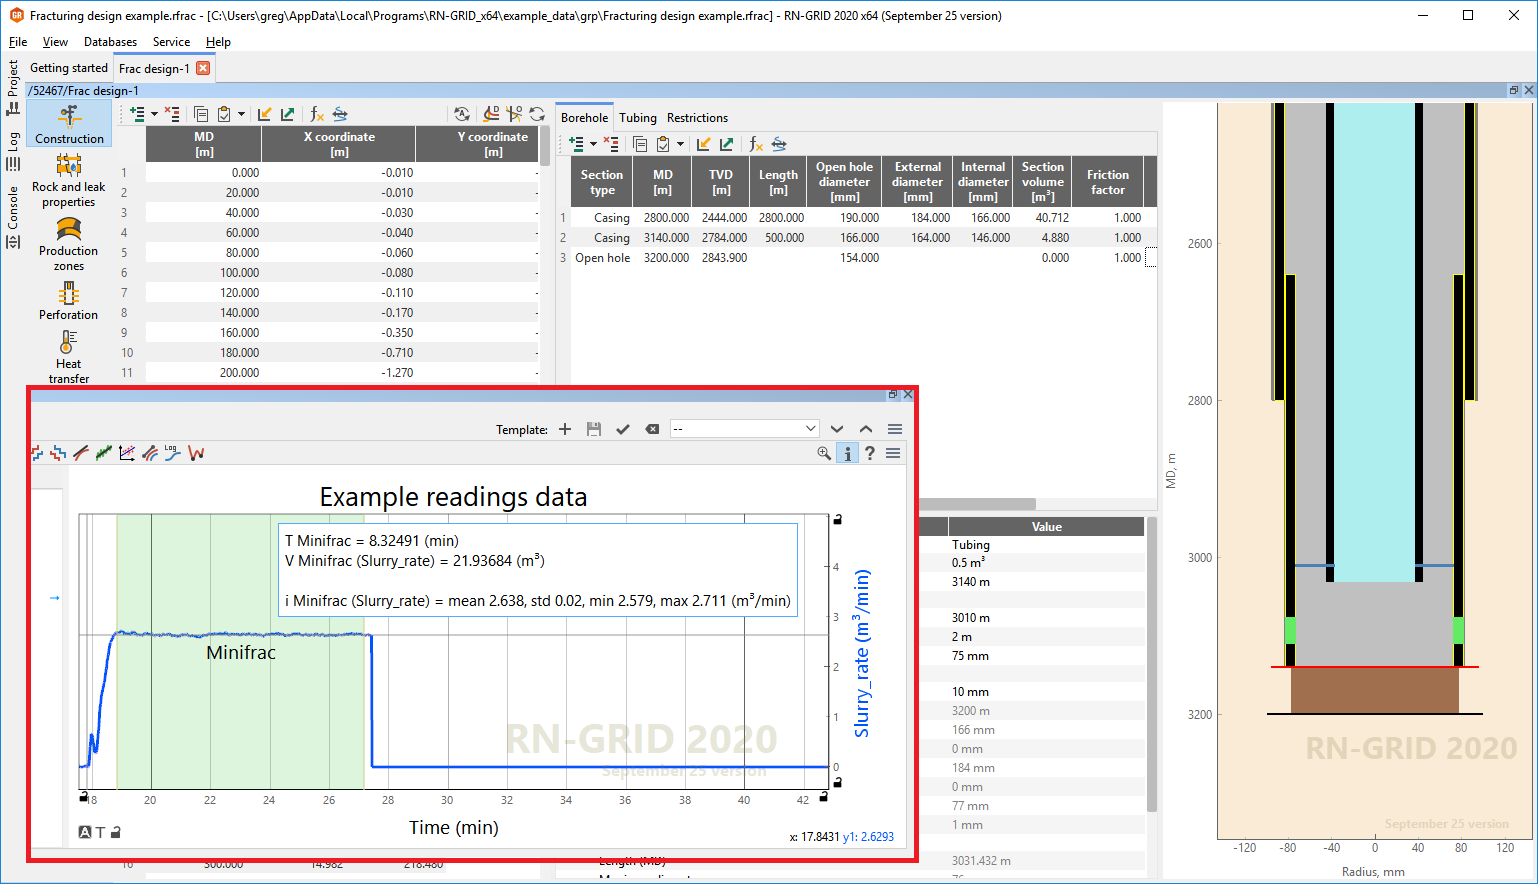
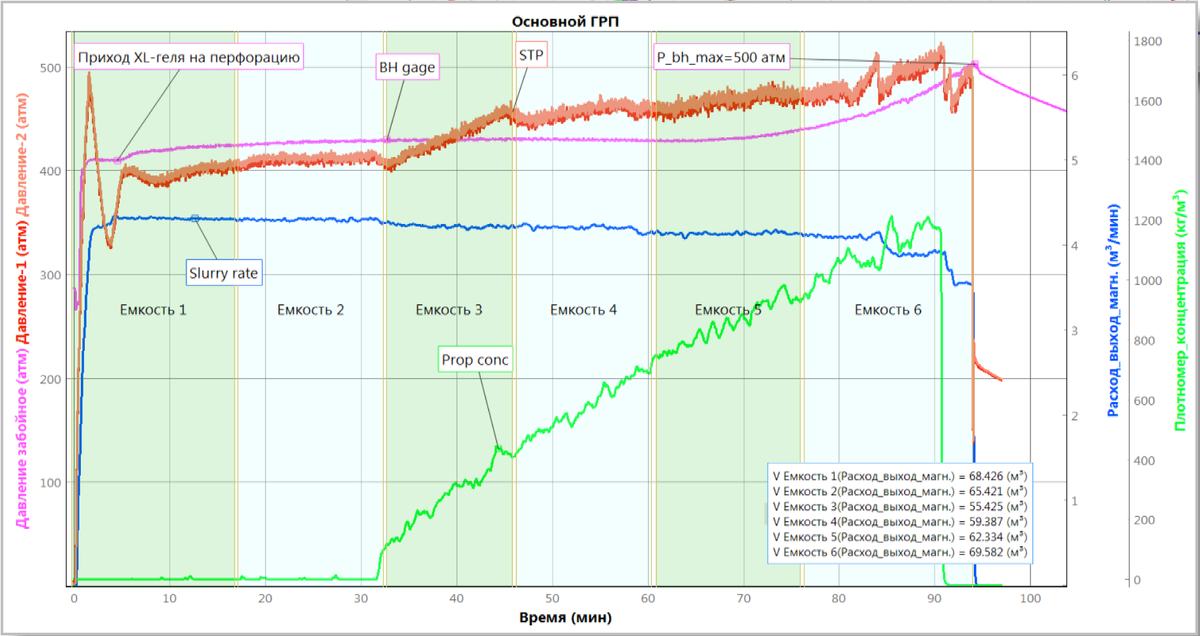
During the treatment, a fracturing fluid (gel, in some cases water, or acid for acid fracturing) is pumped into the formation under high pressure, which opens an extended fracture. To maintain the fracture in the open state after injection is stopped, a propping agent is used — a proppant, ceramic particles of a certain size and spherical shape. When the fluid leaks off fracture to the reservoir, the proppant-filled fracture provides several times greater conductivity, and, consequently, an increase in production.
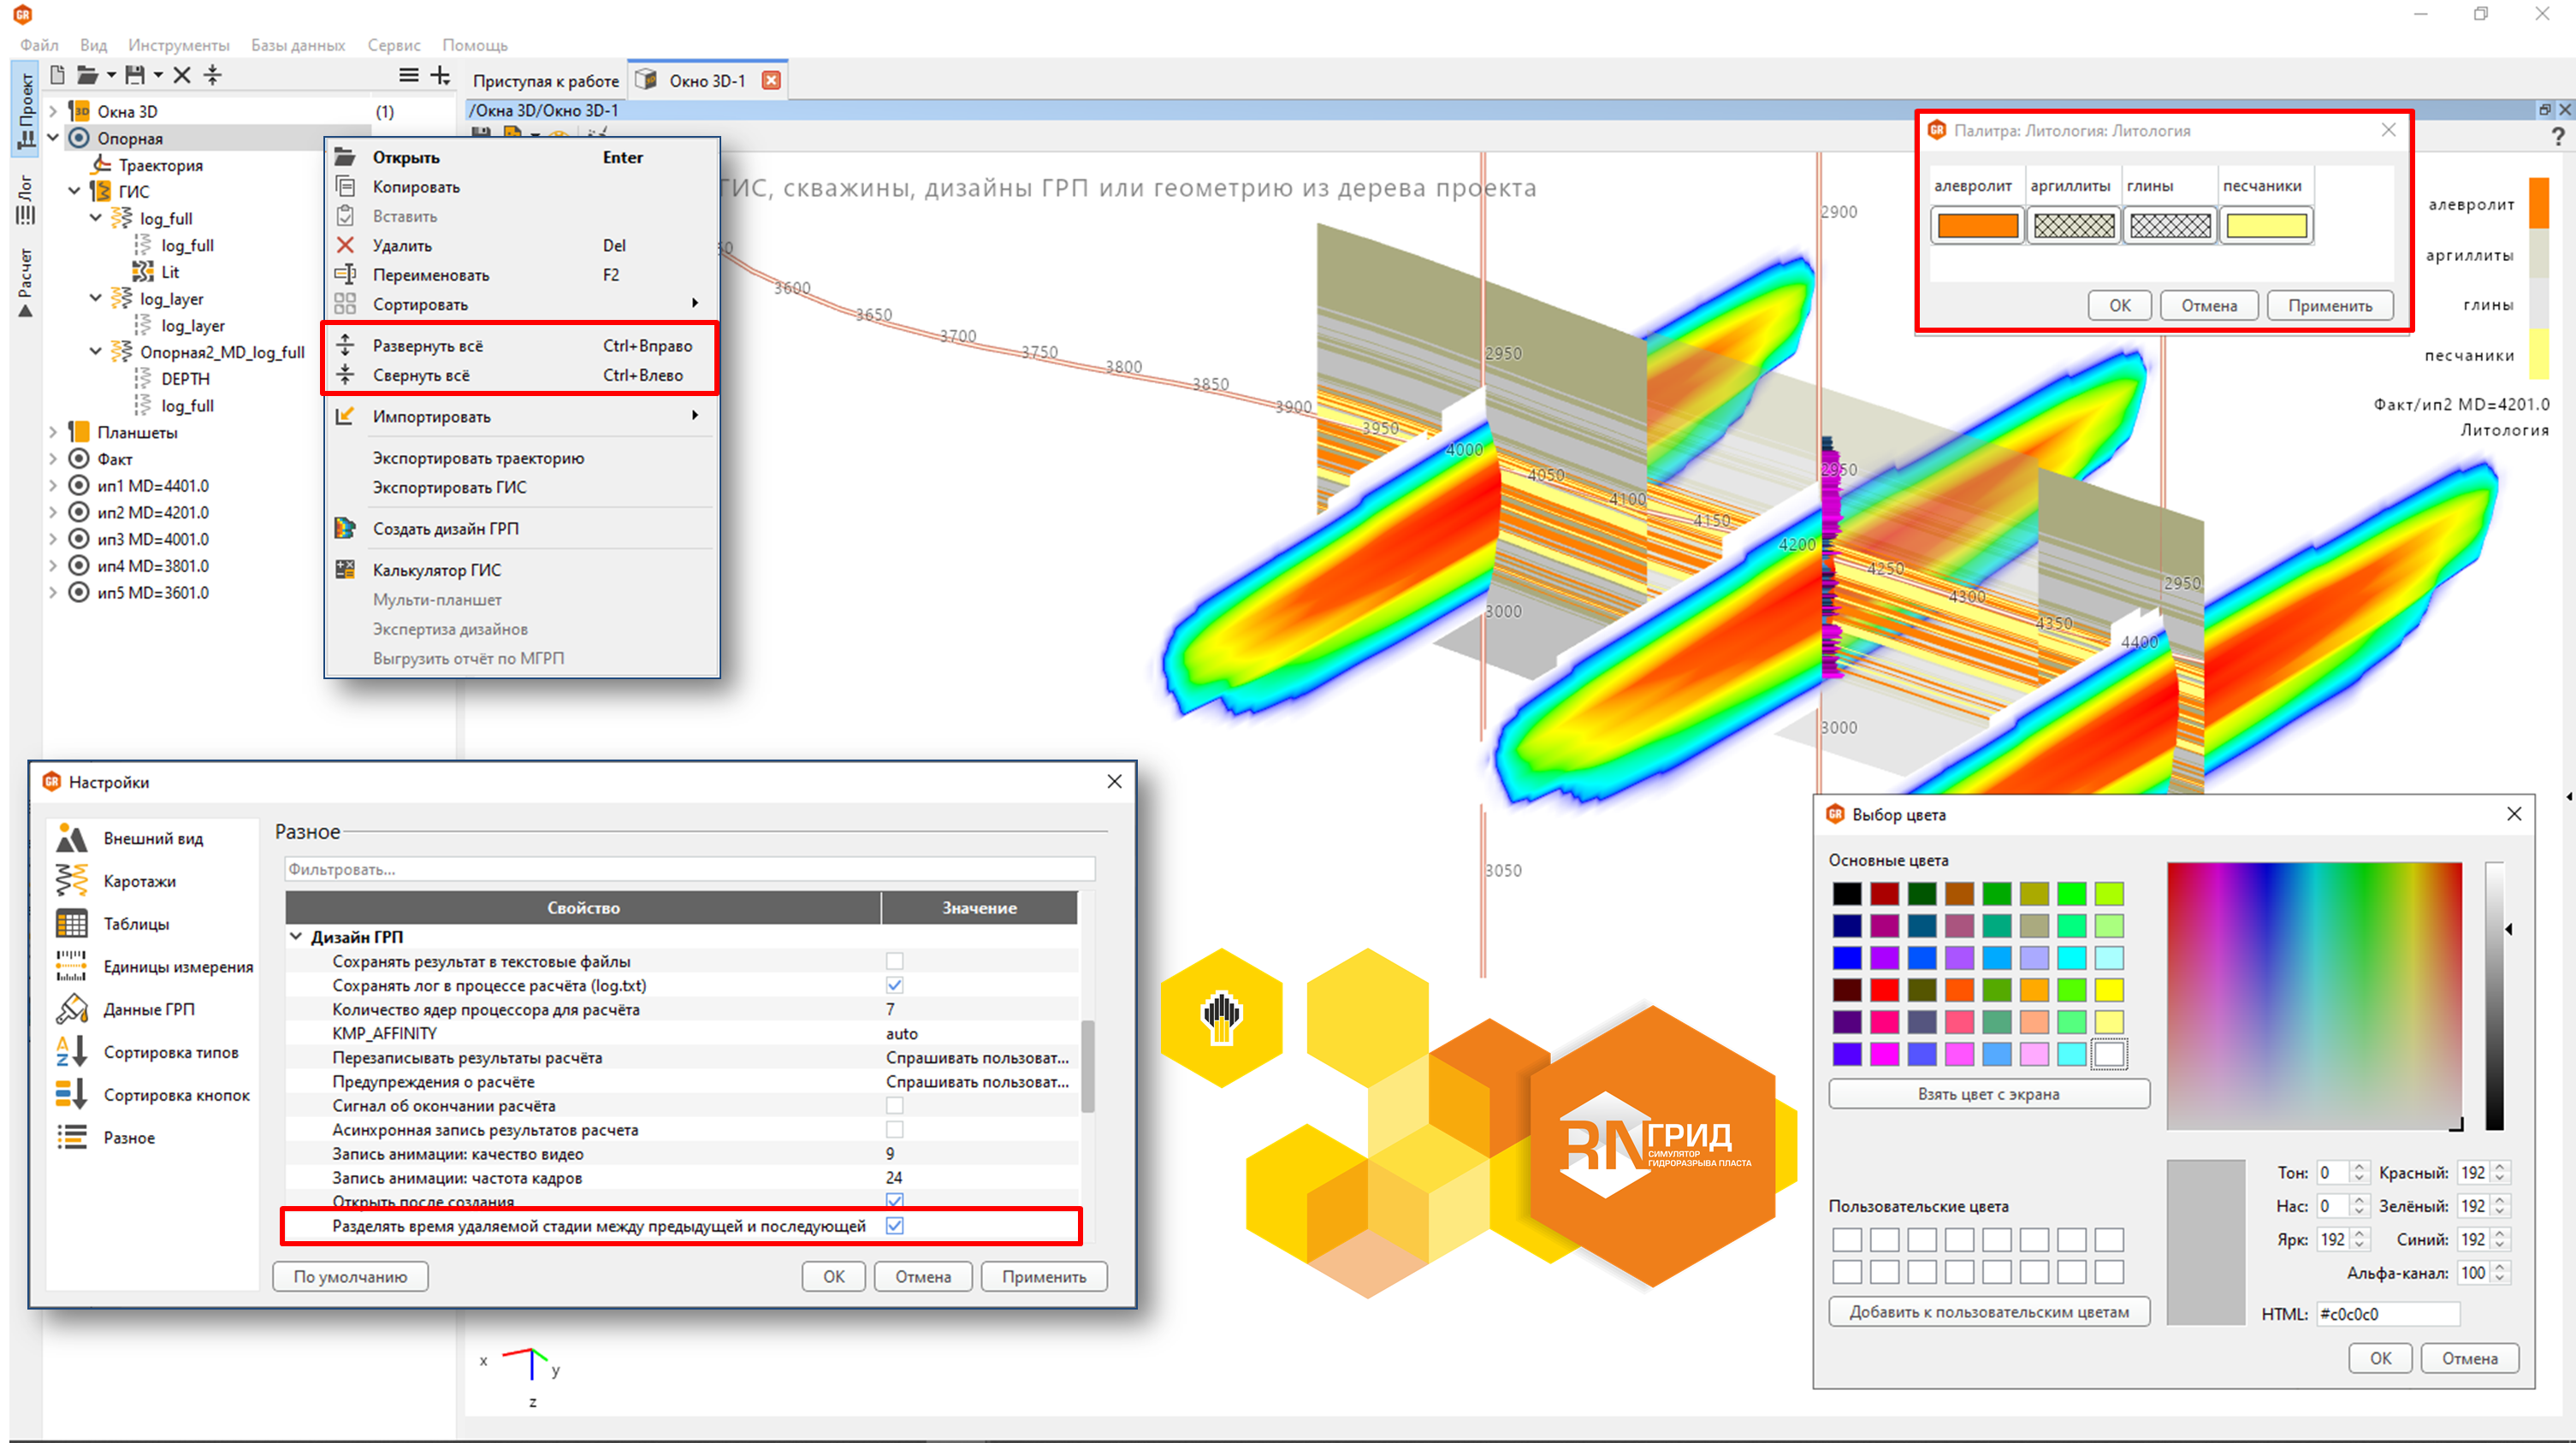
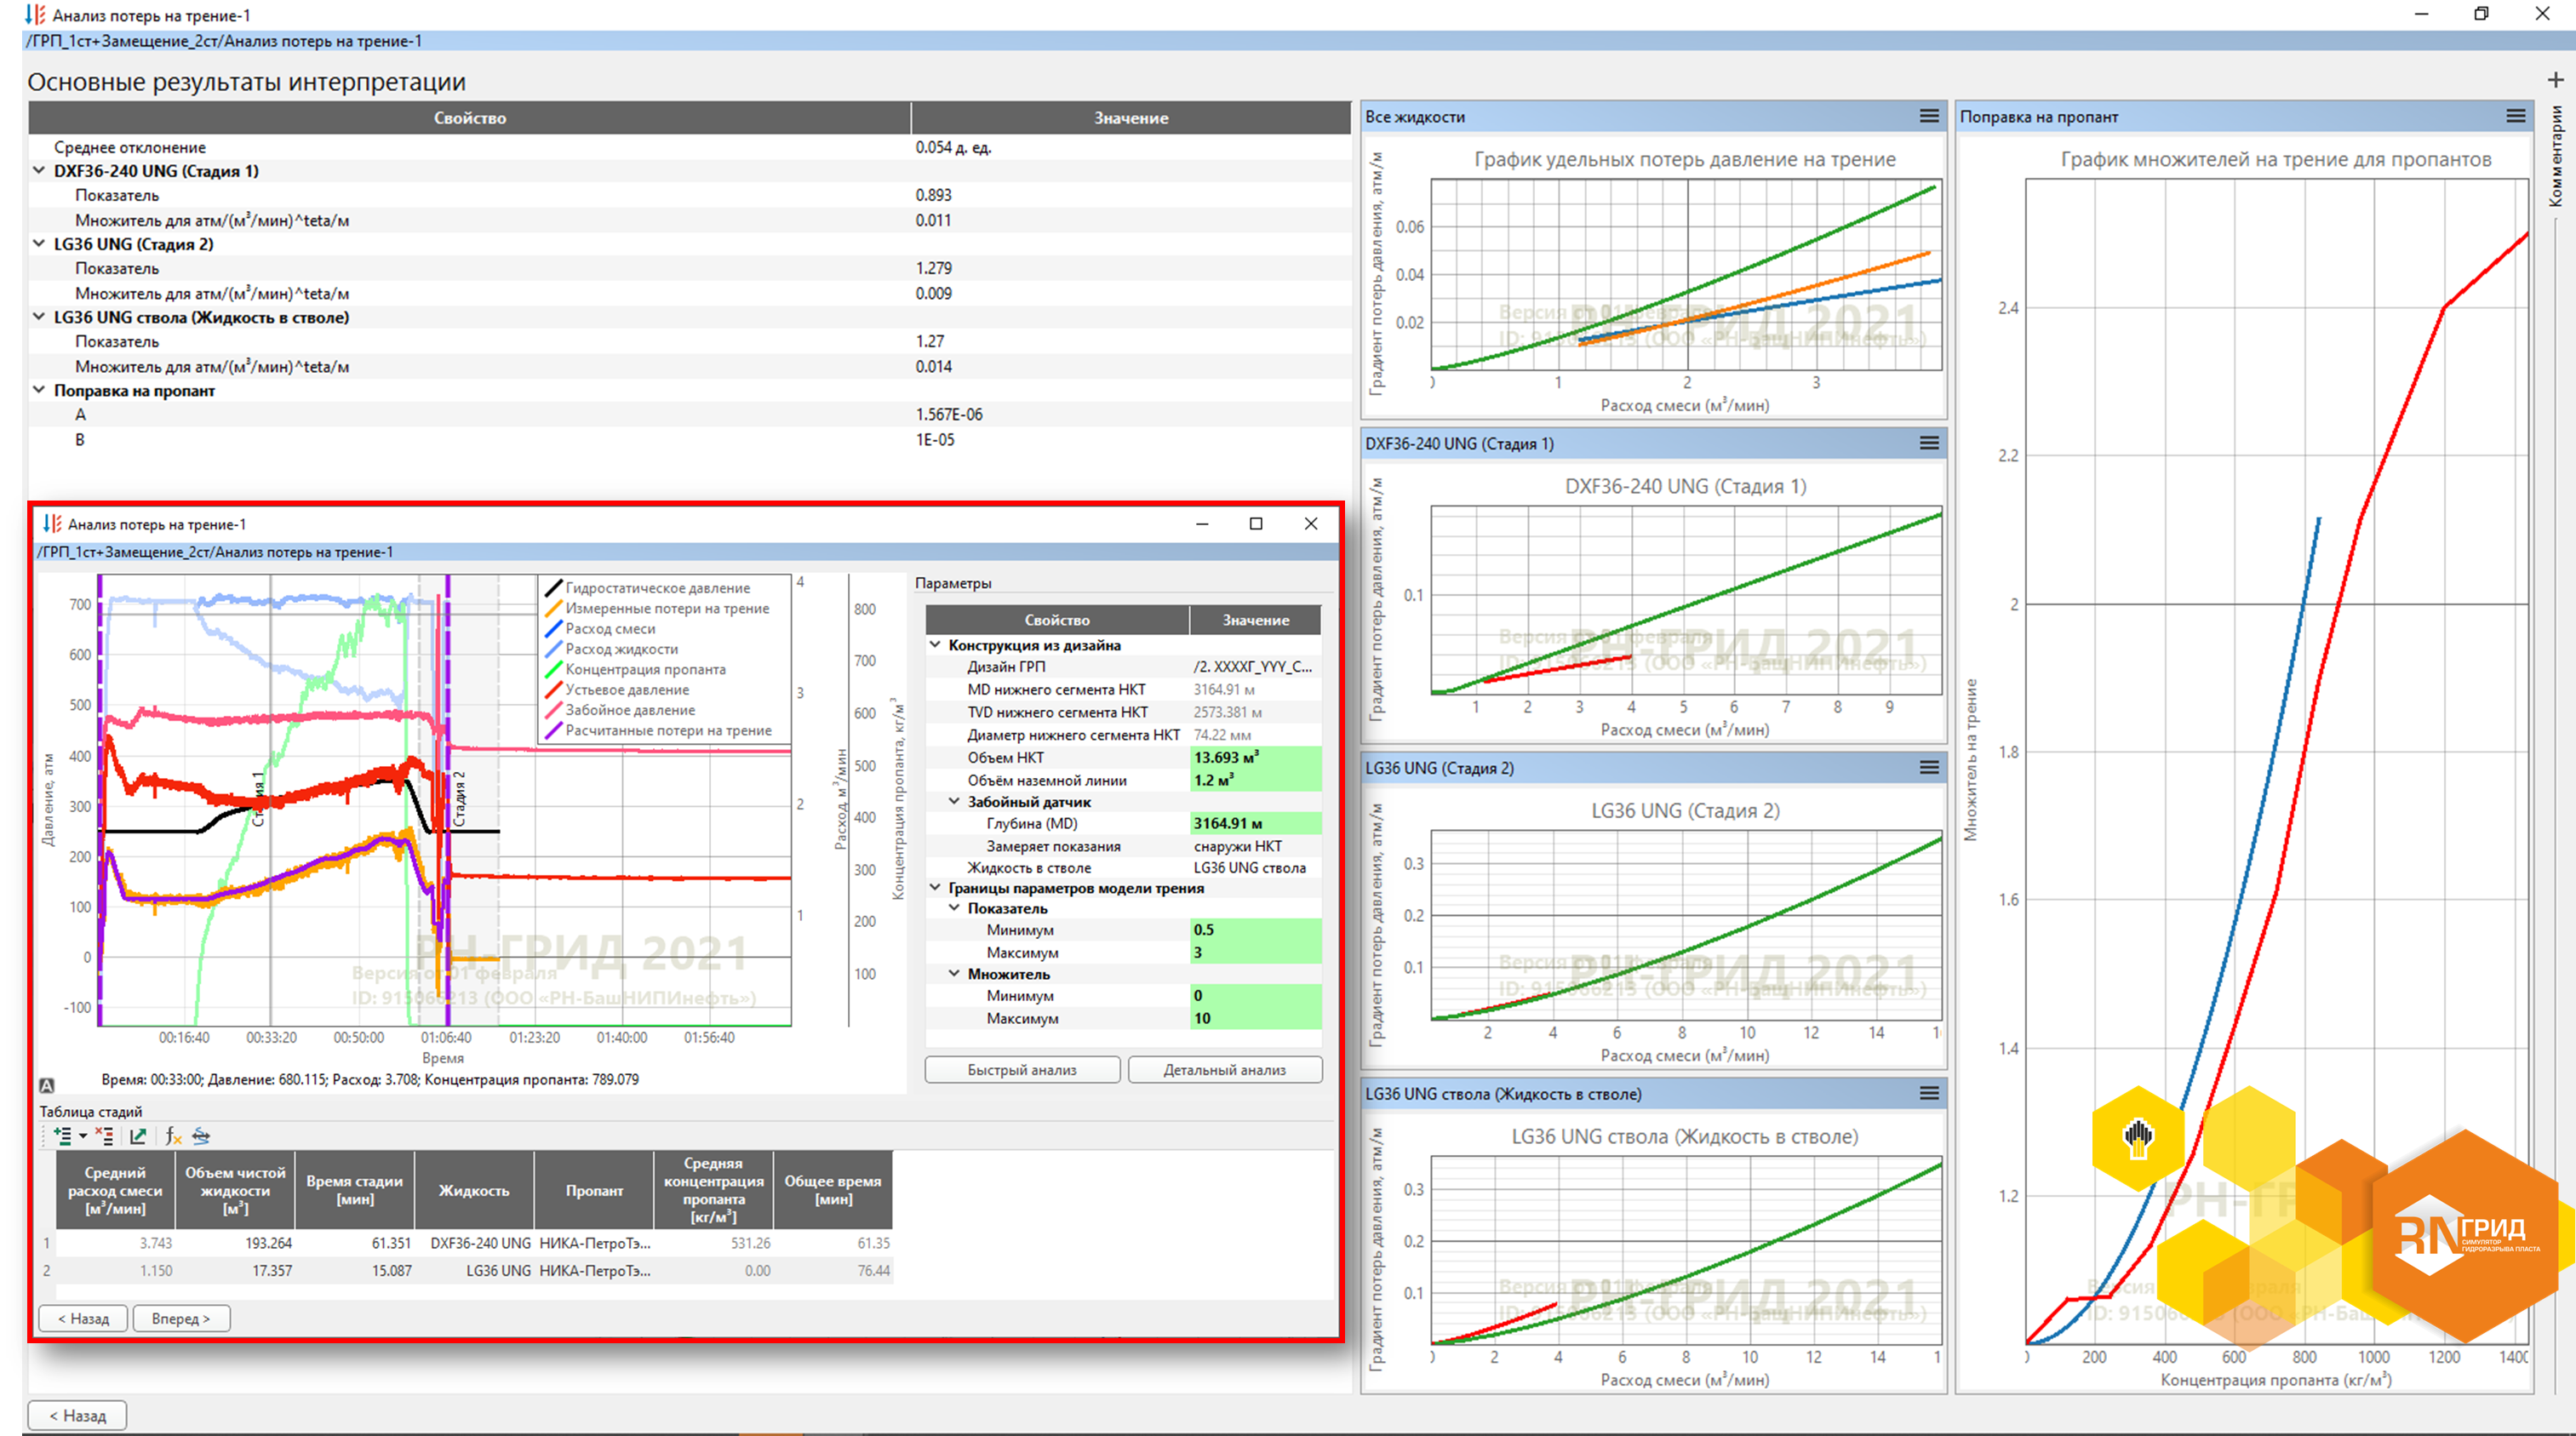
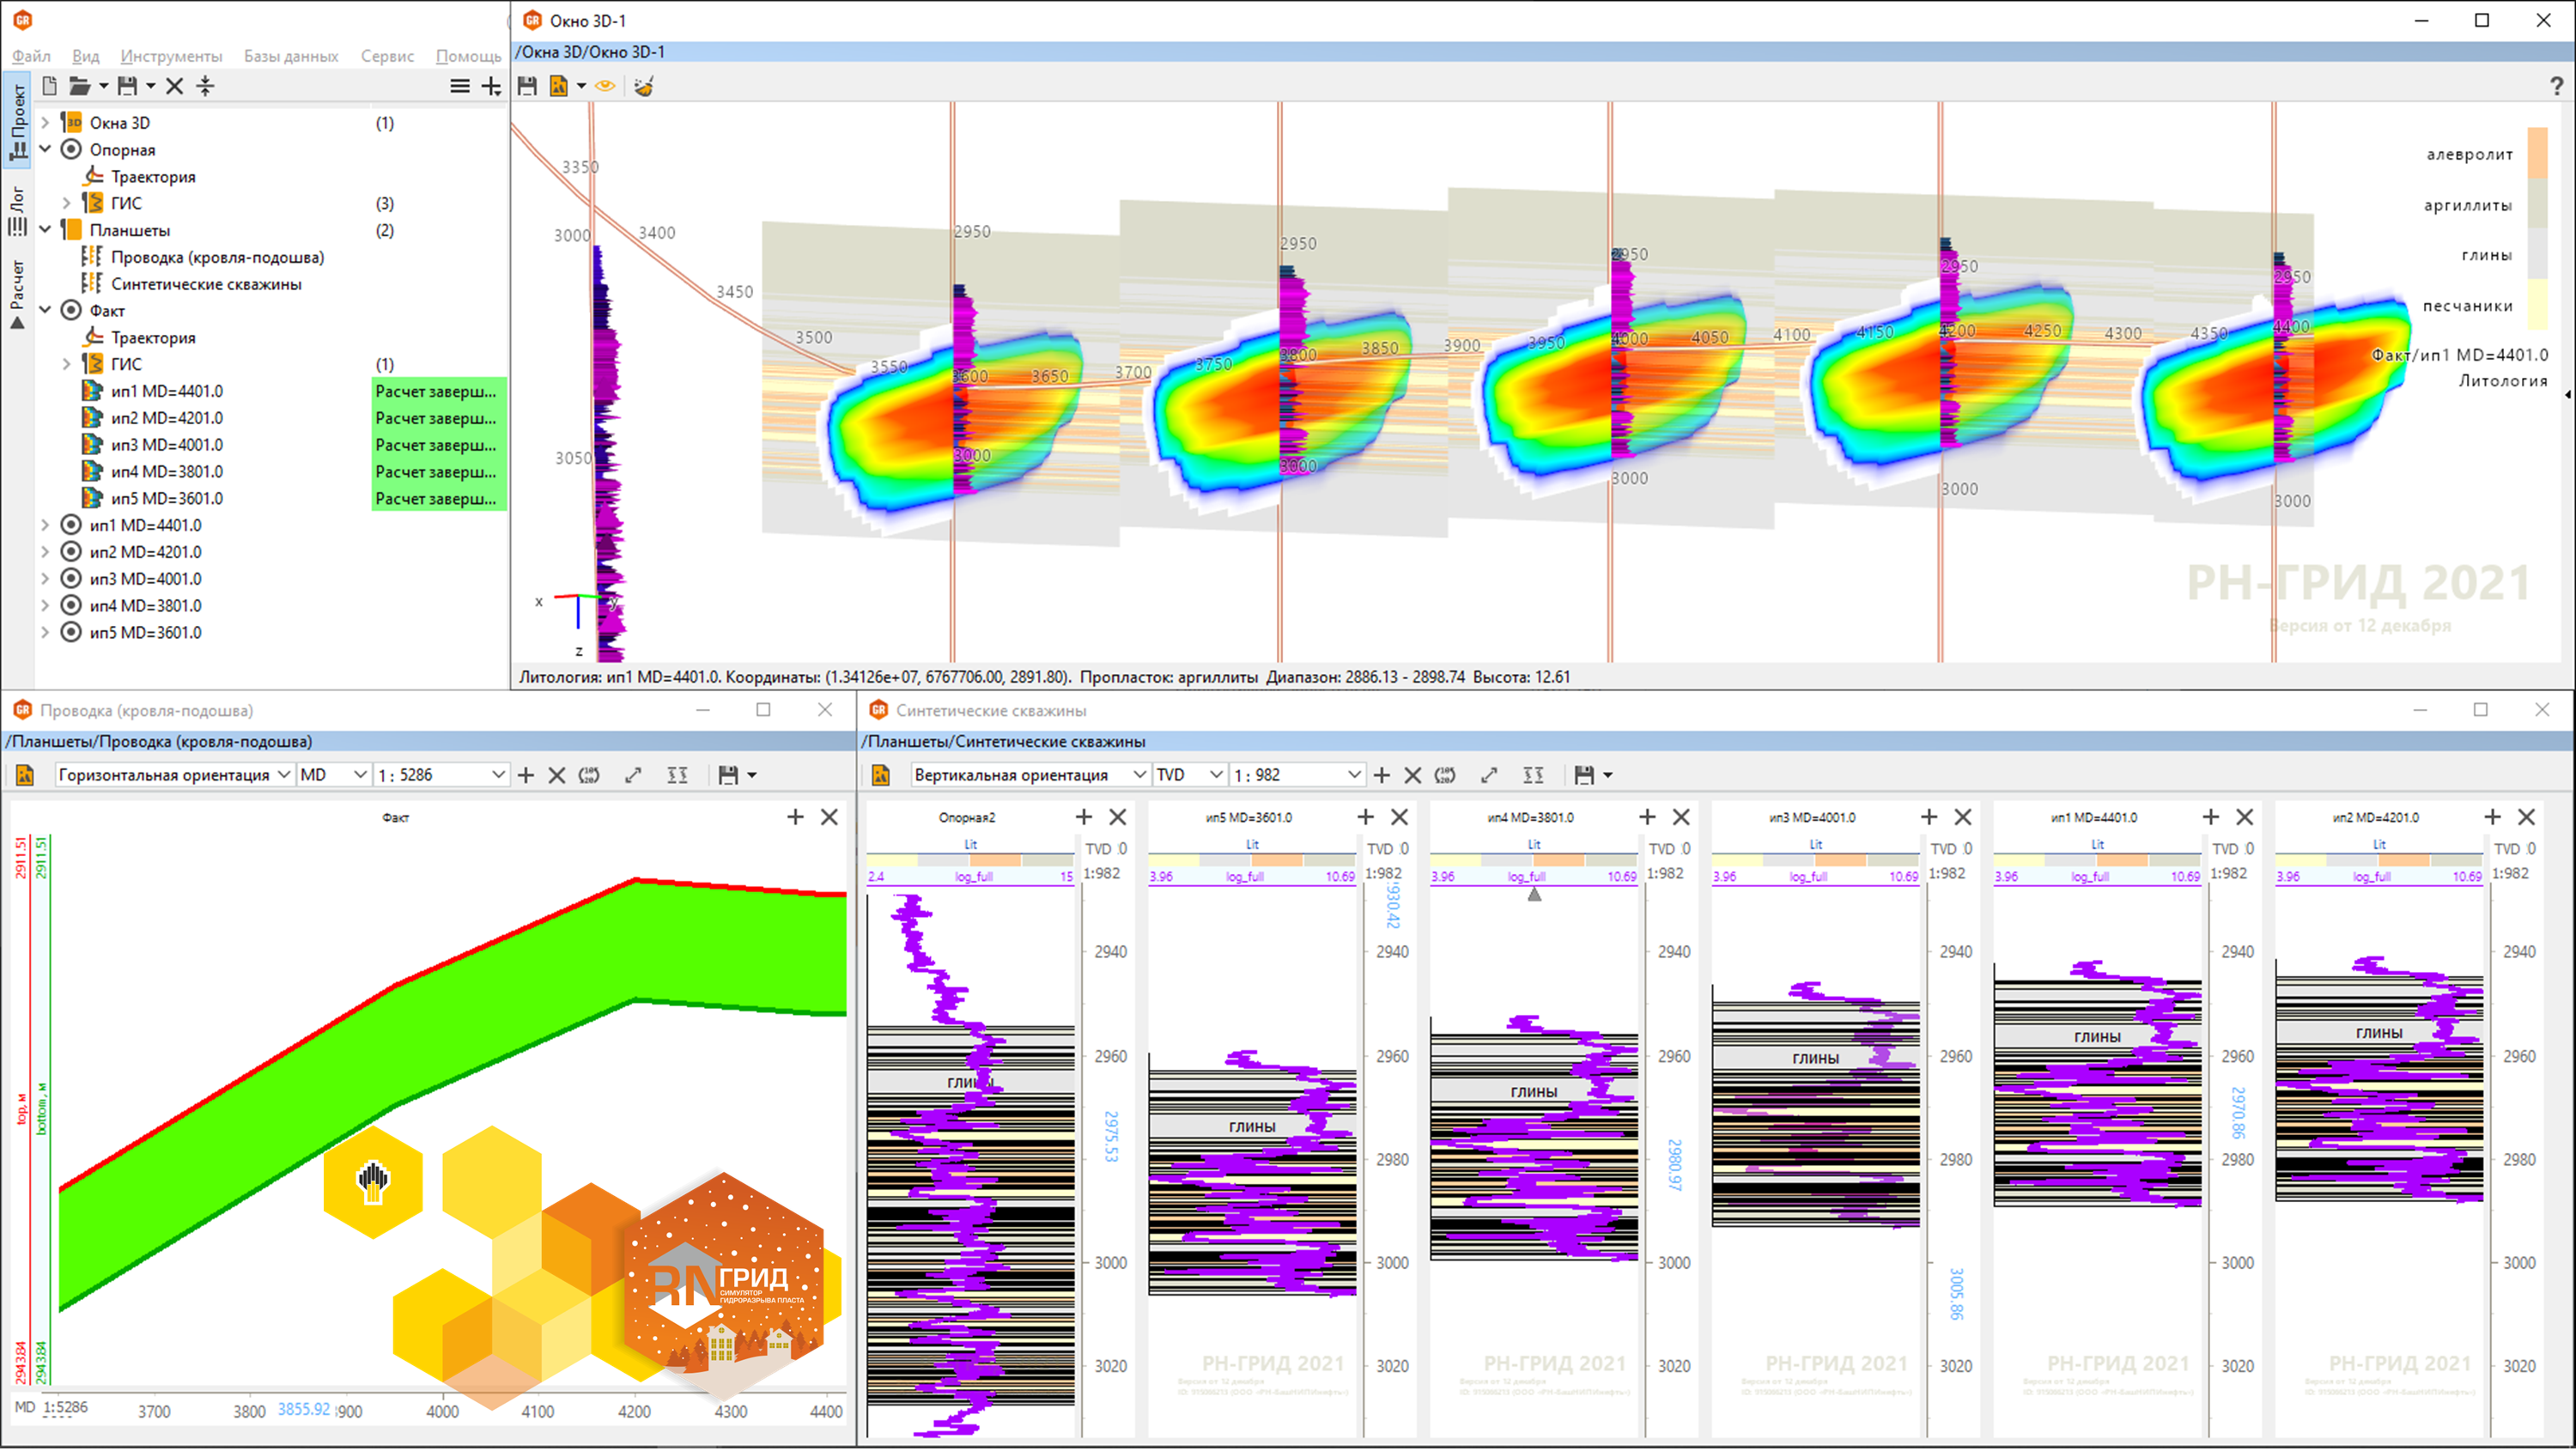
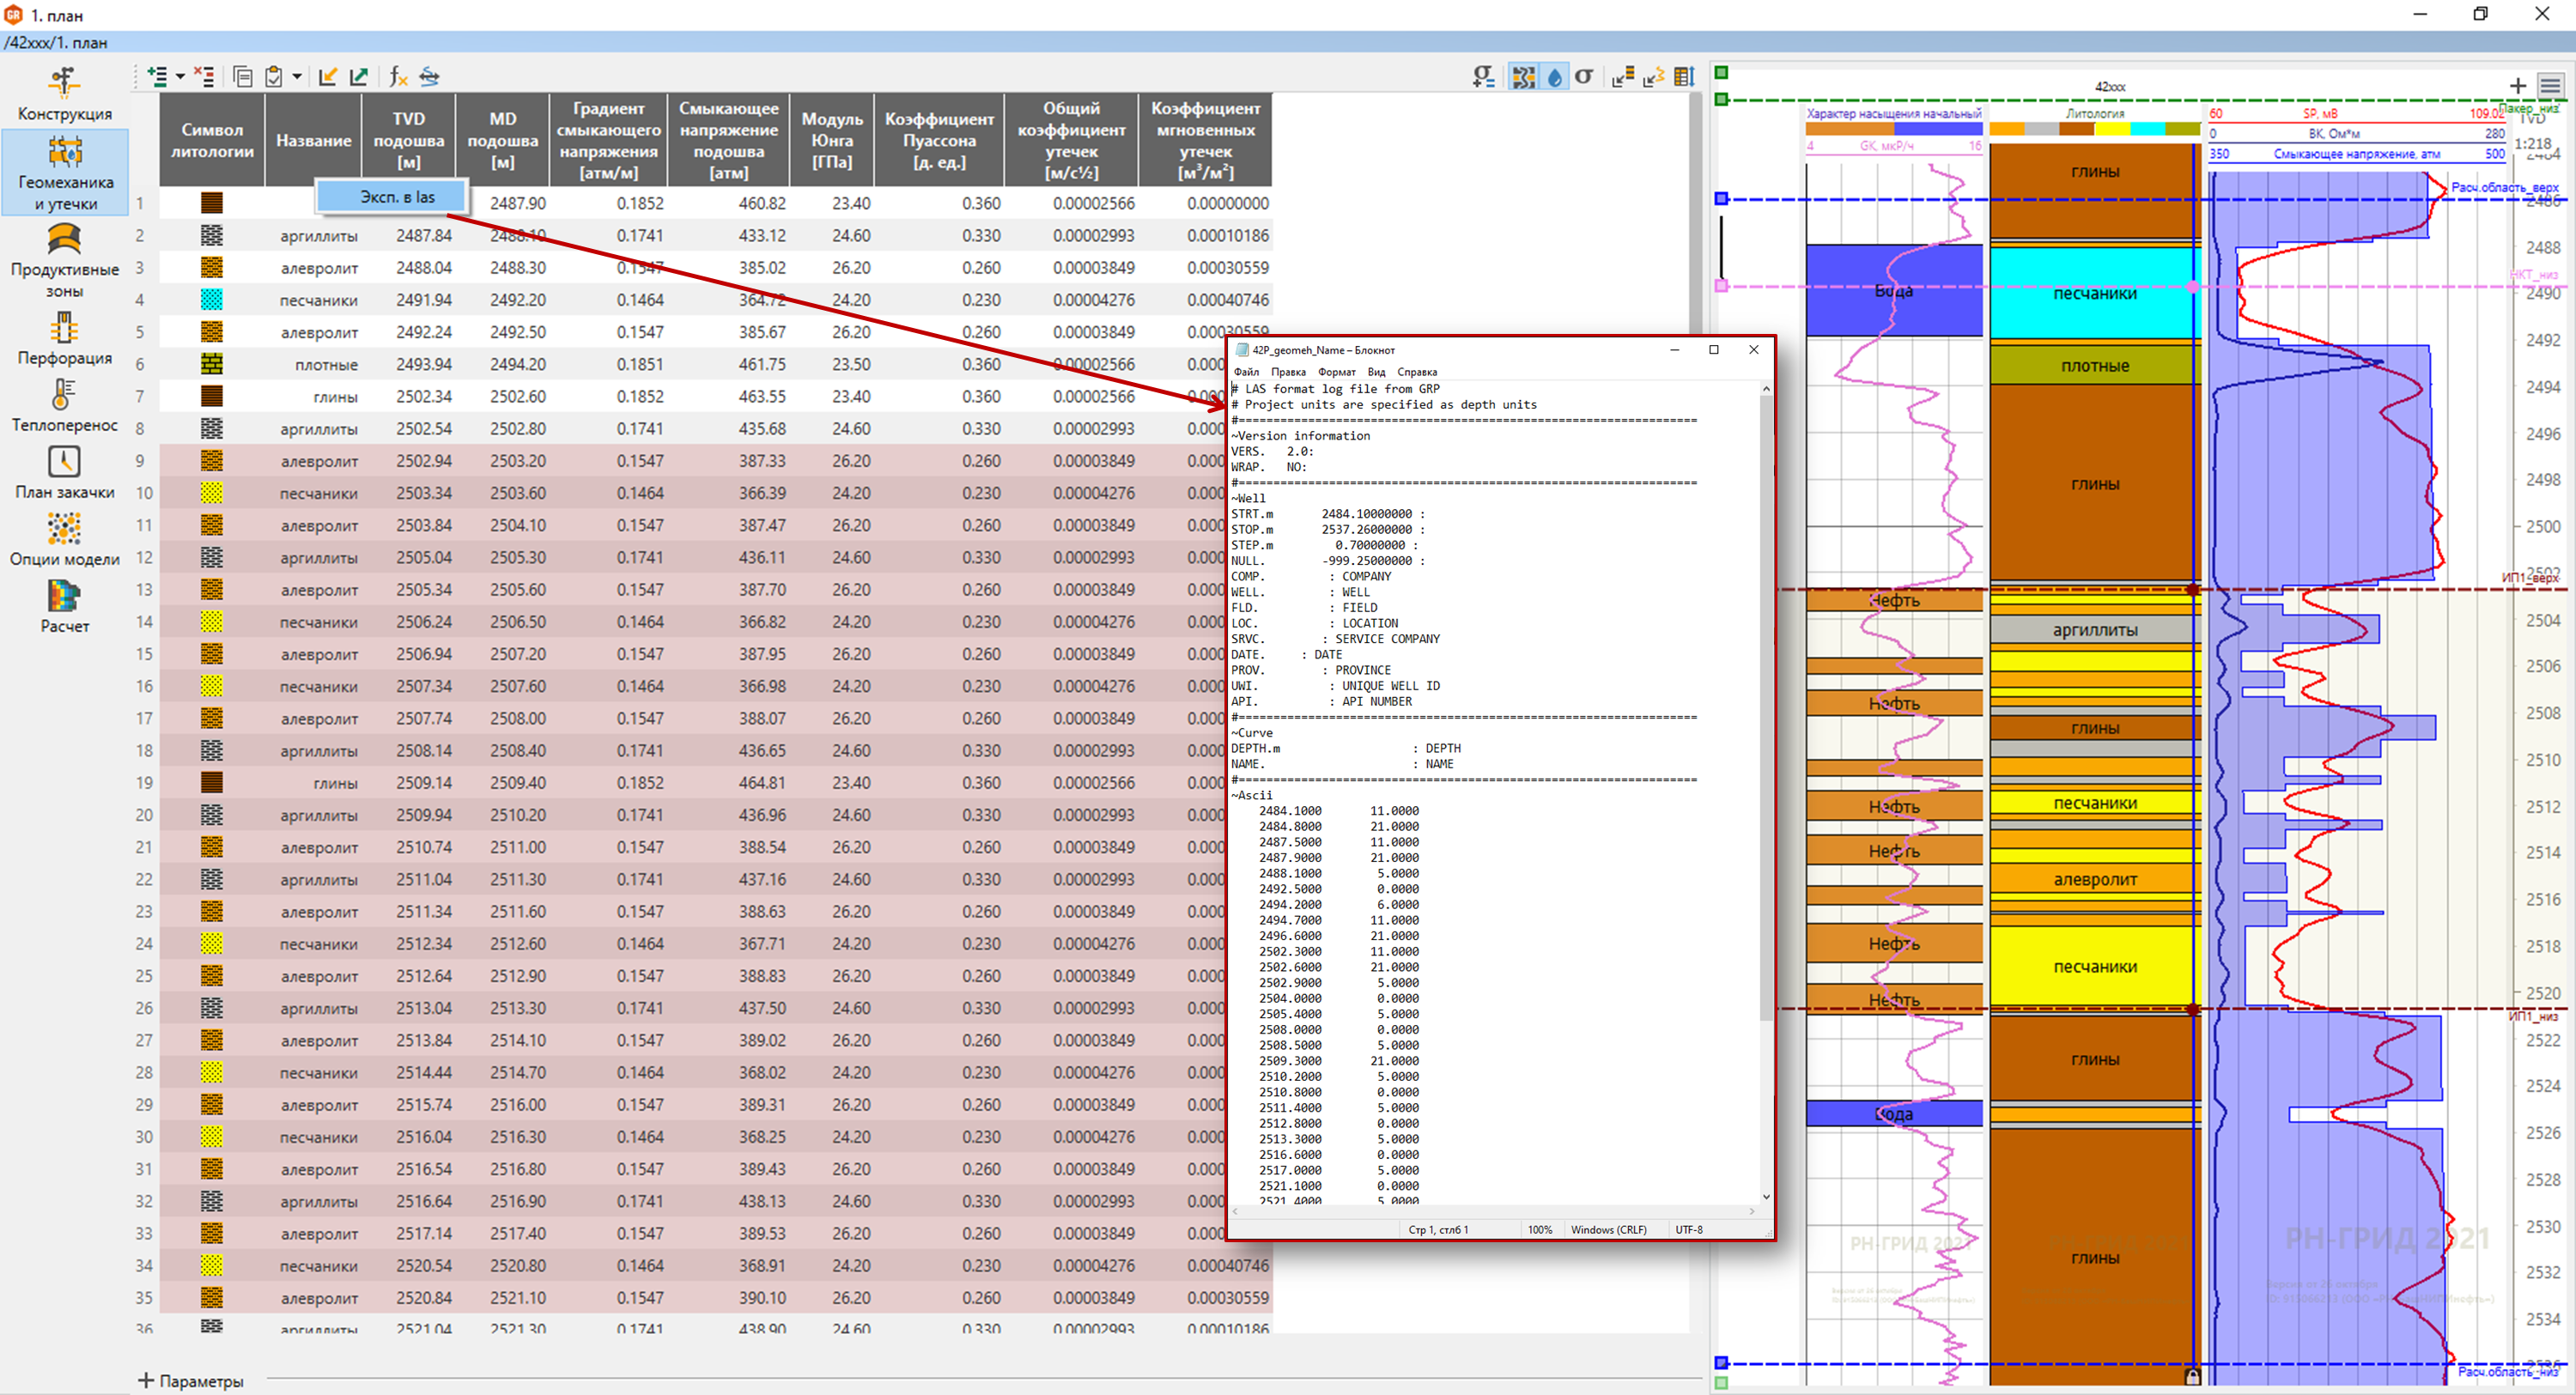
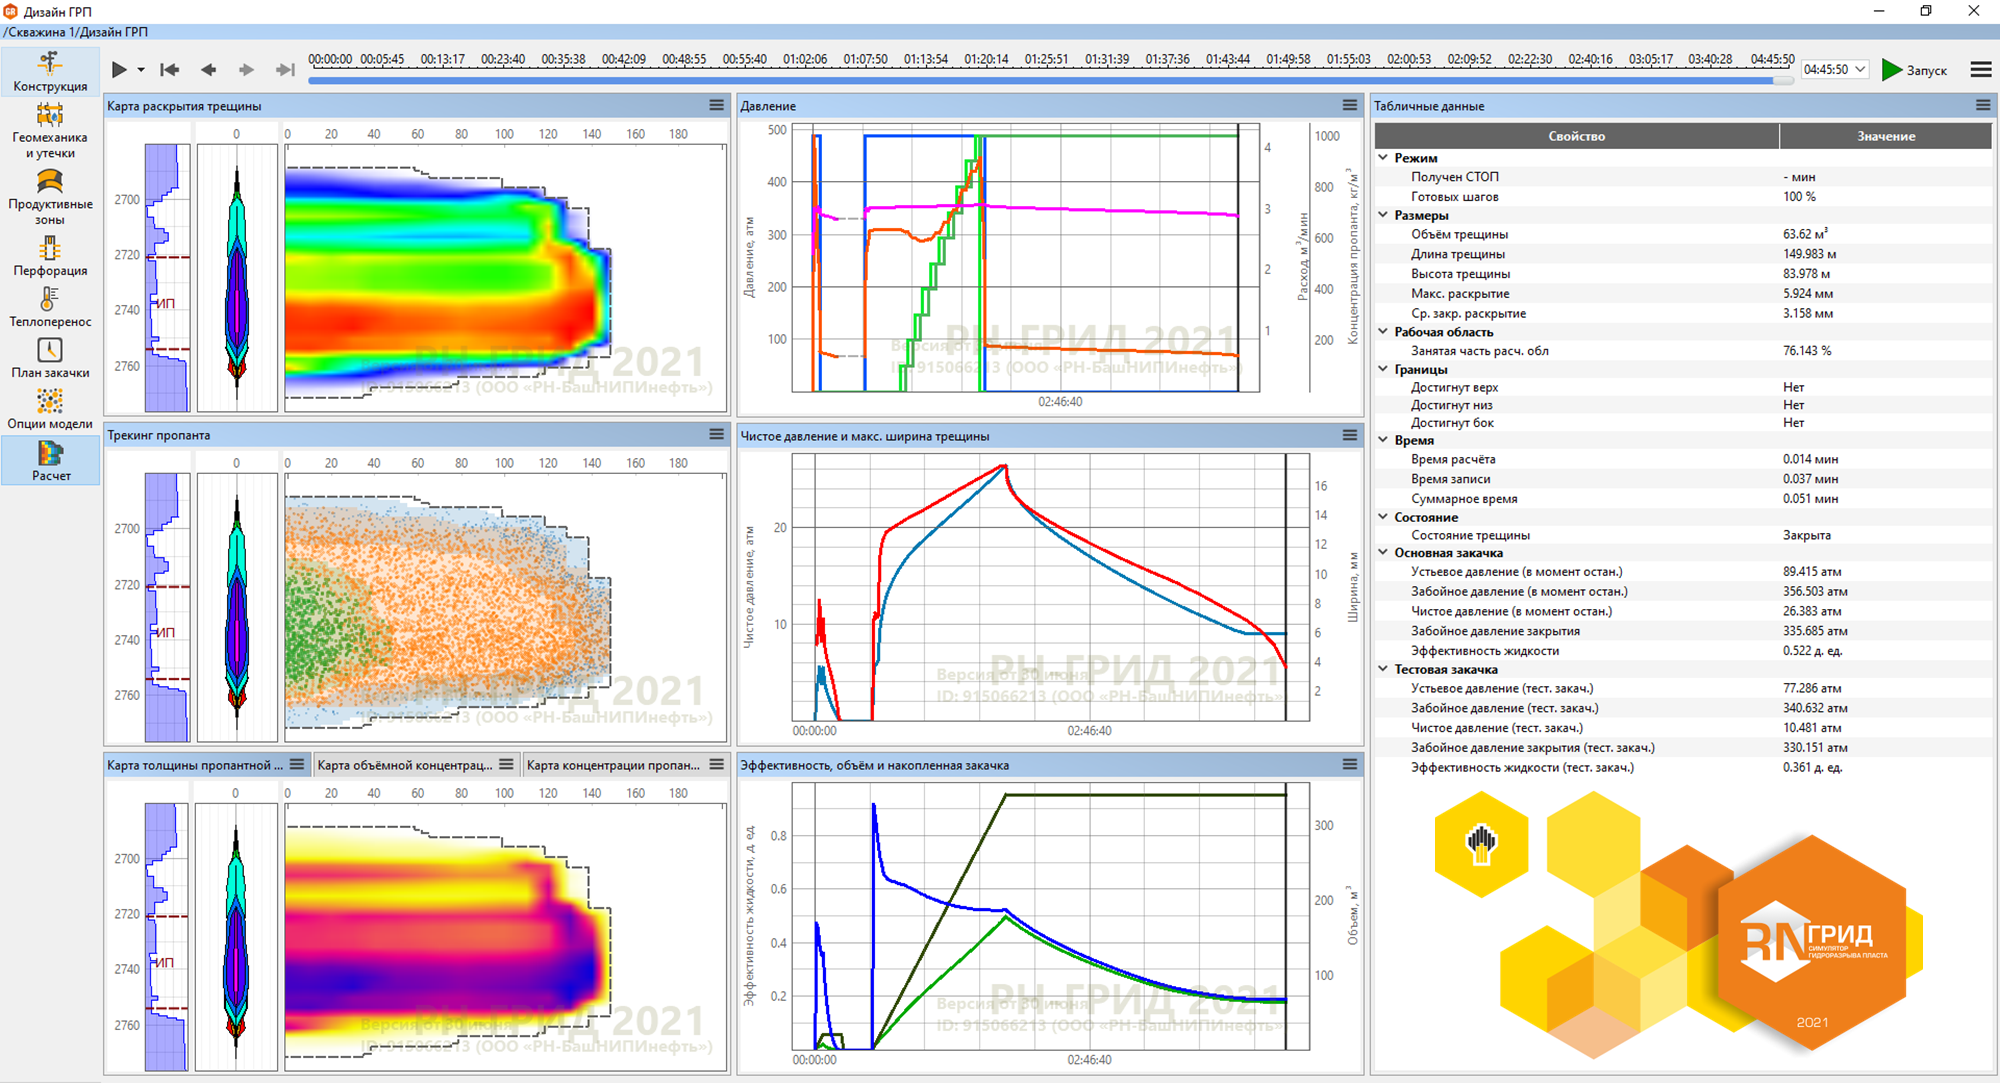
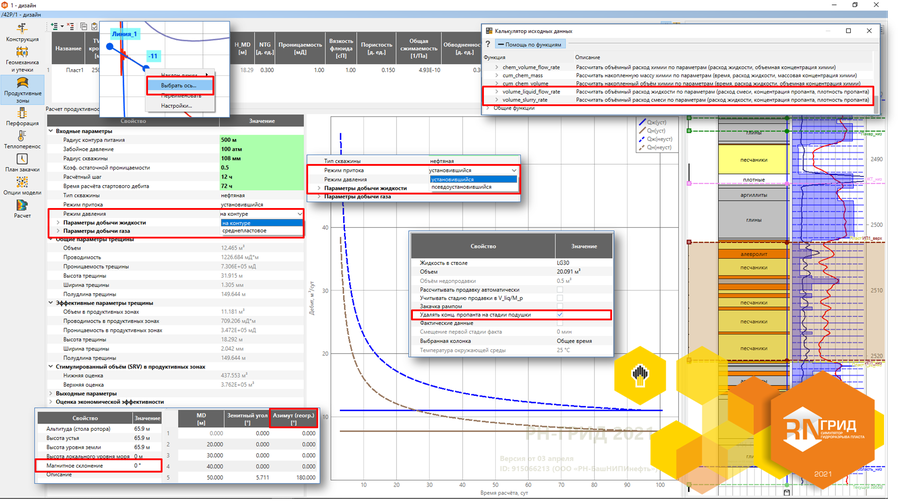
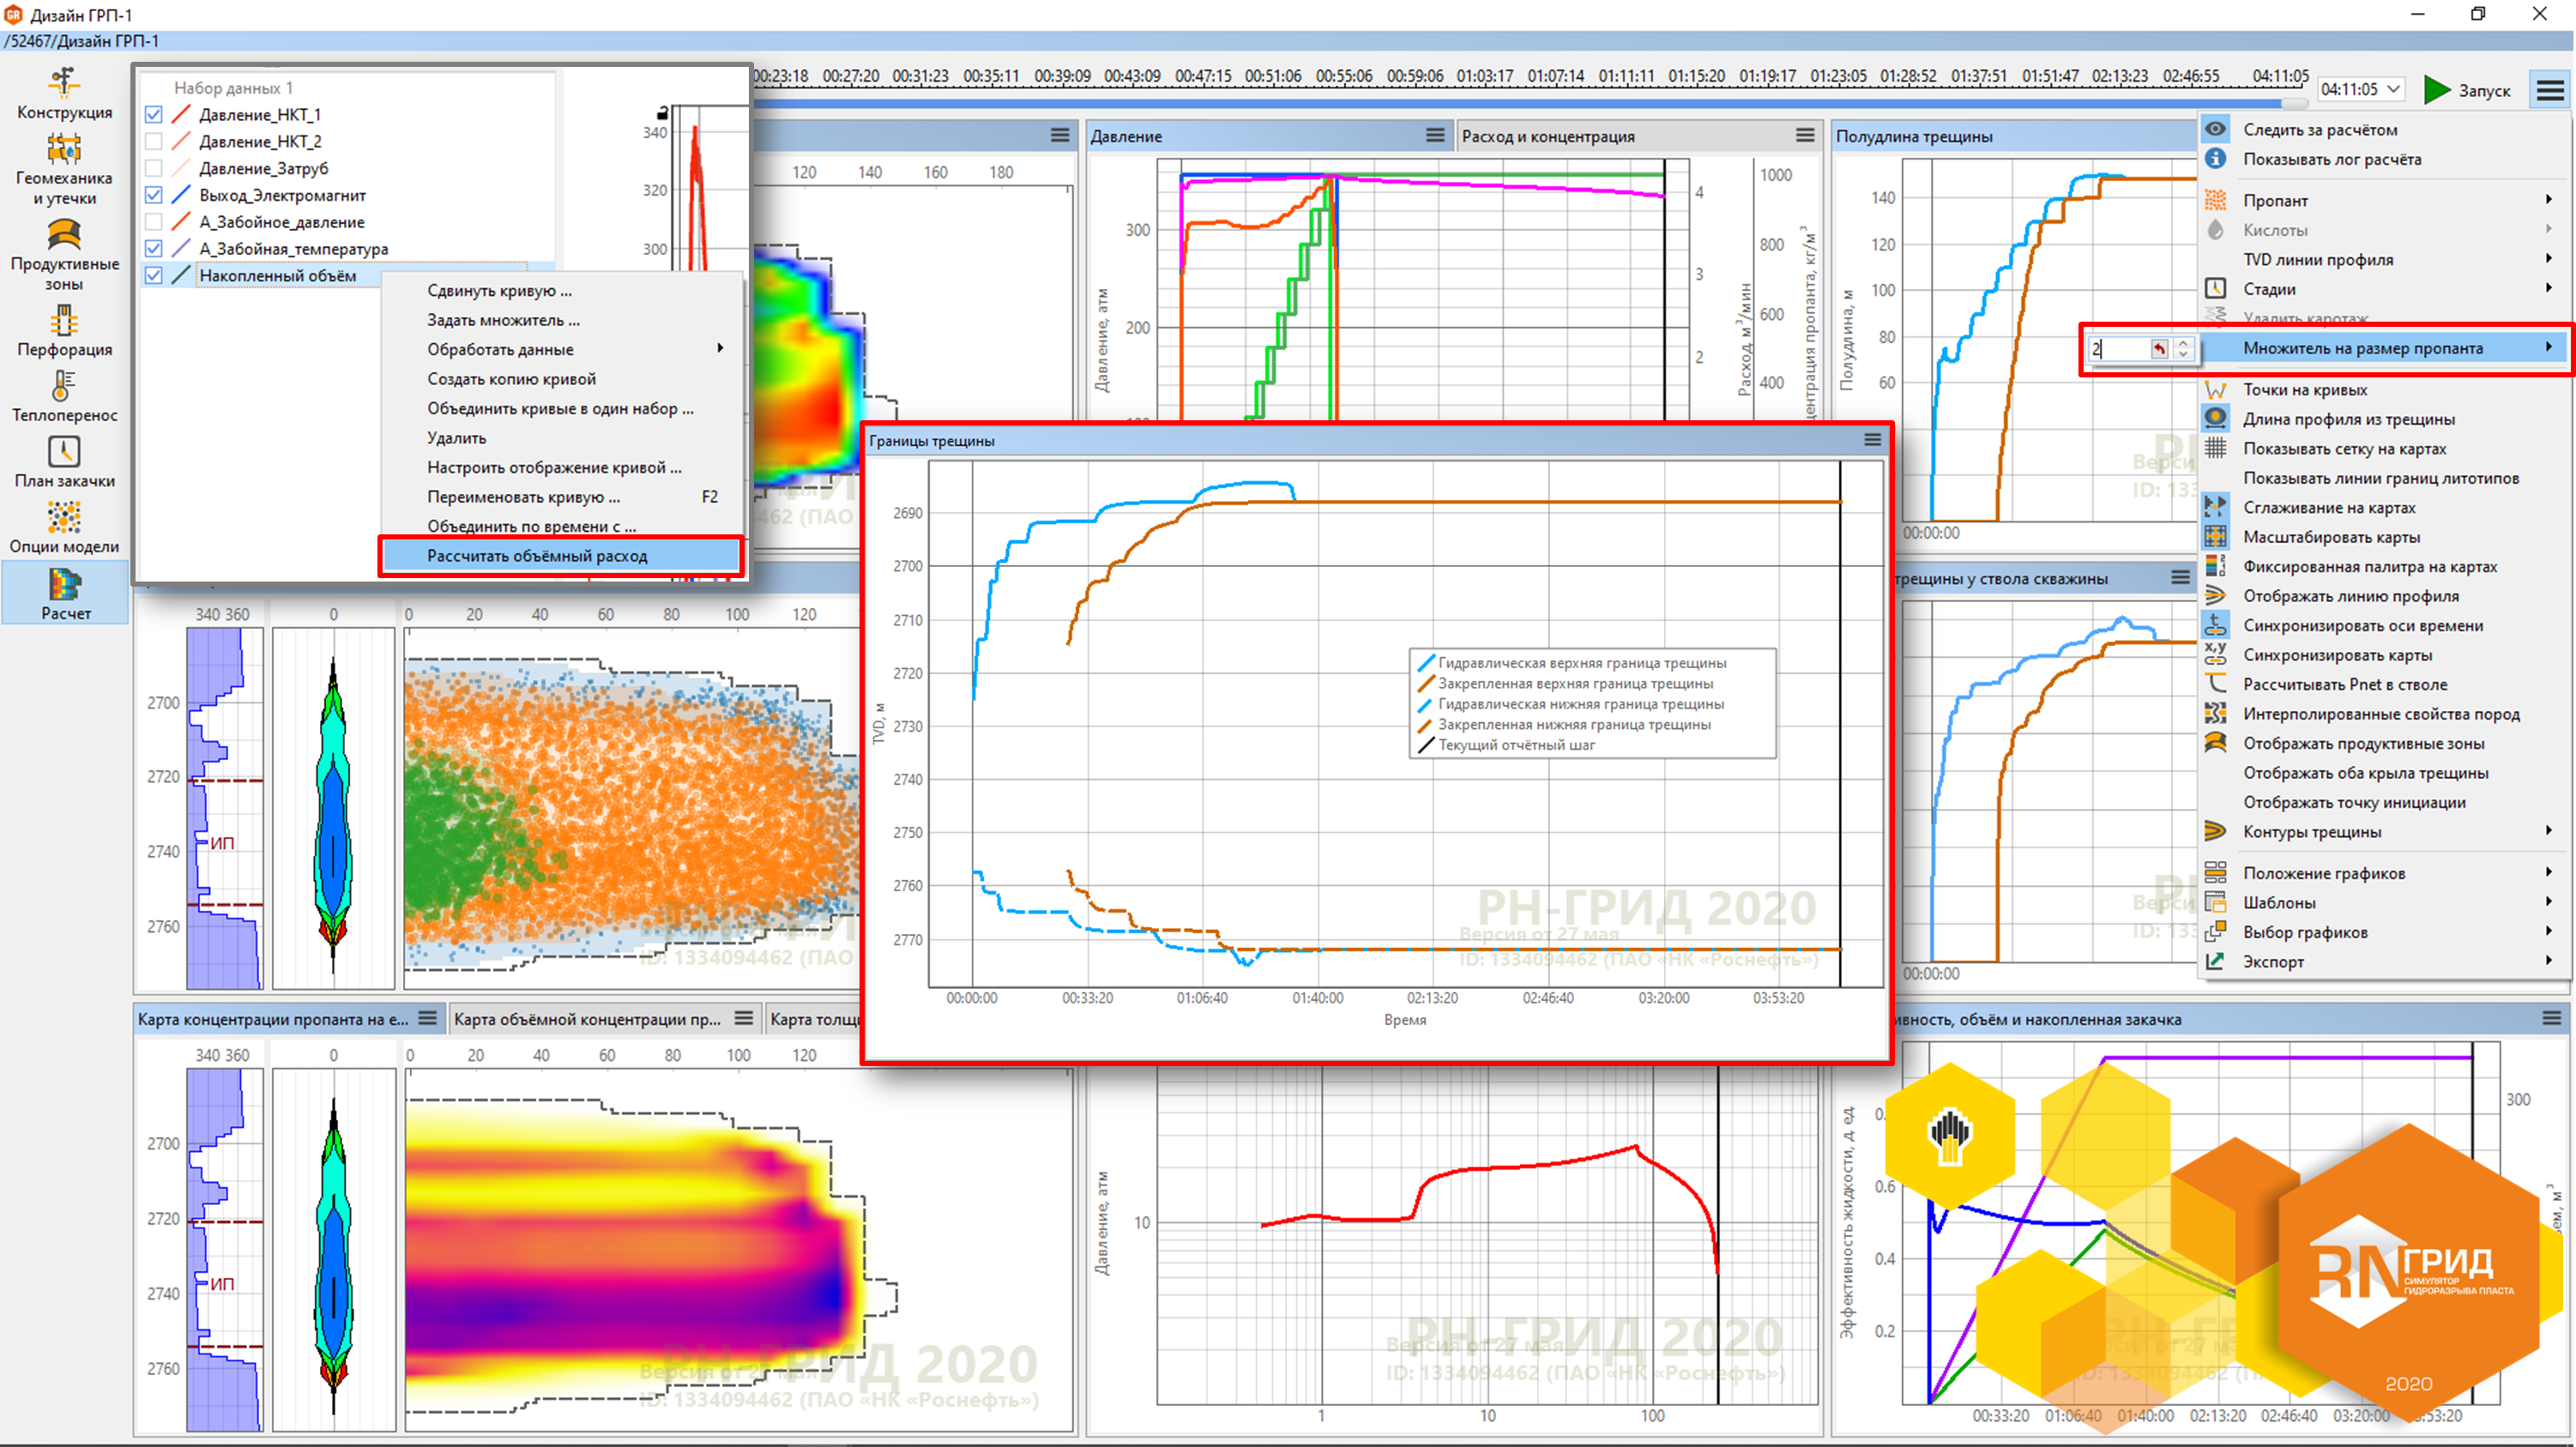
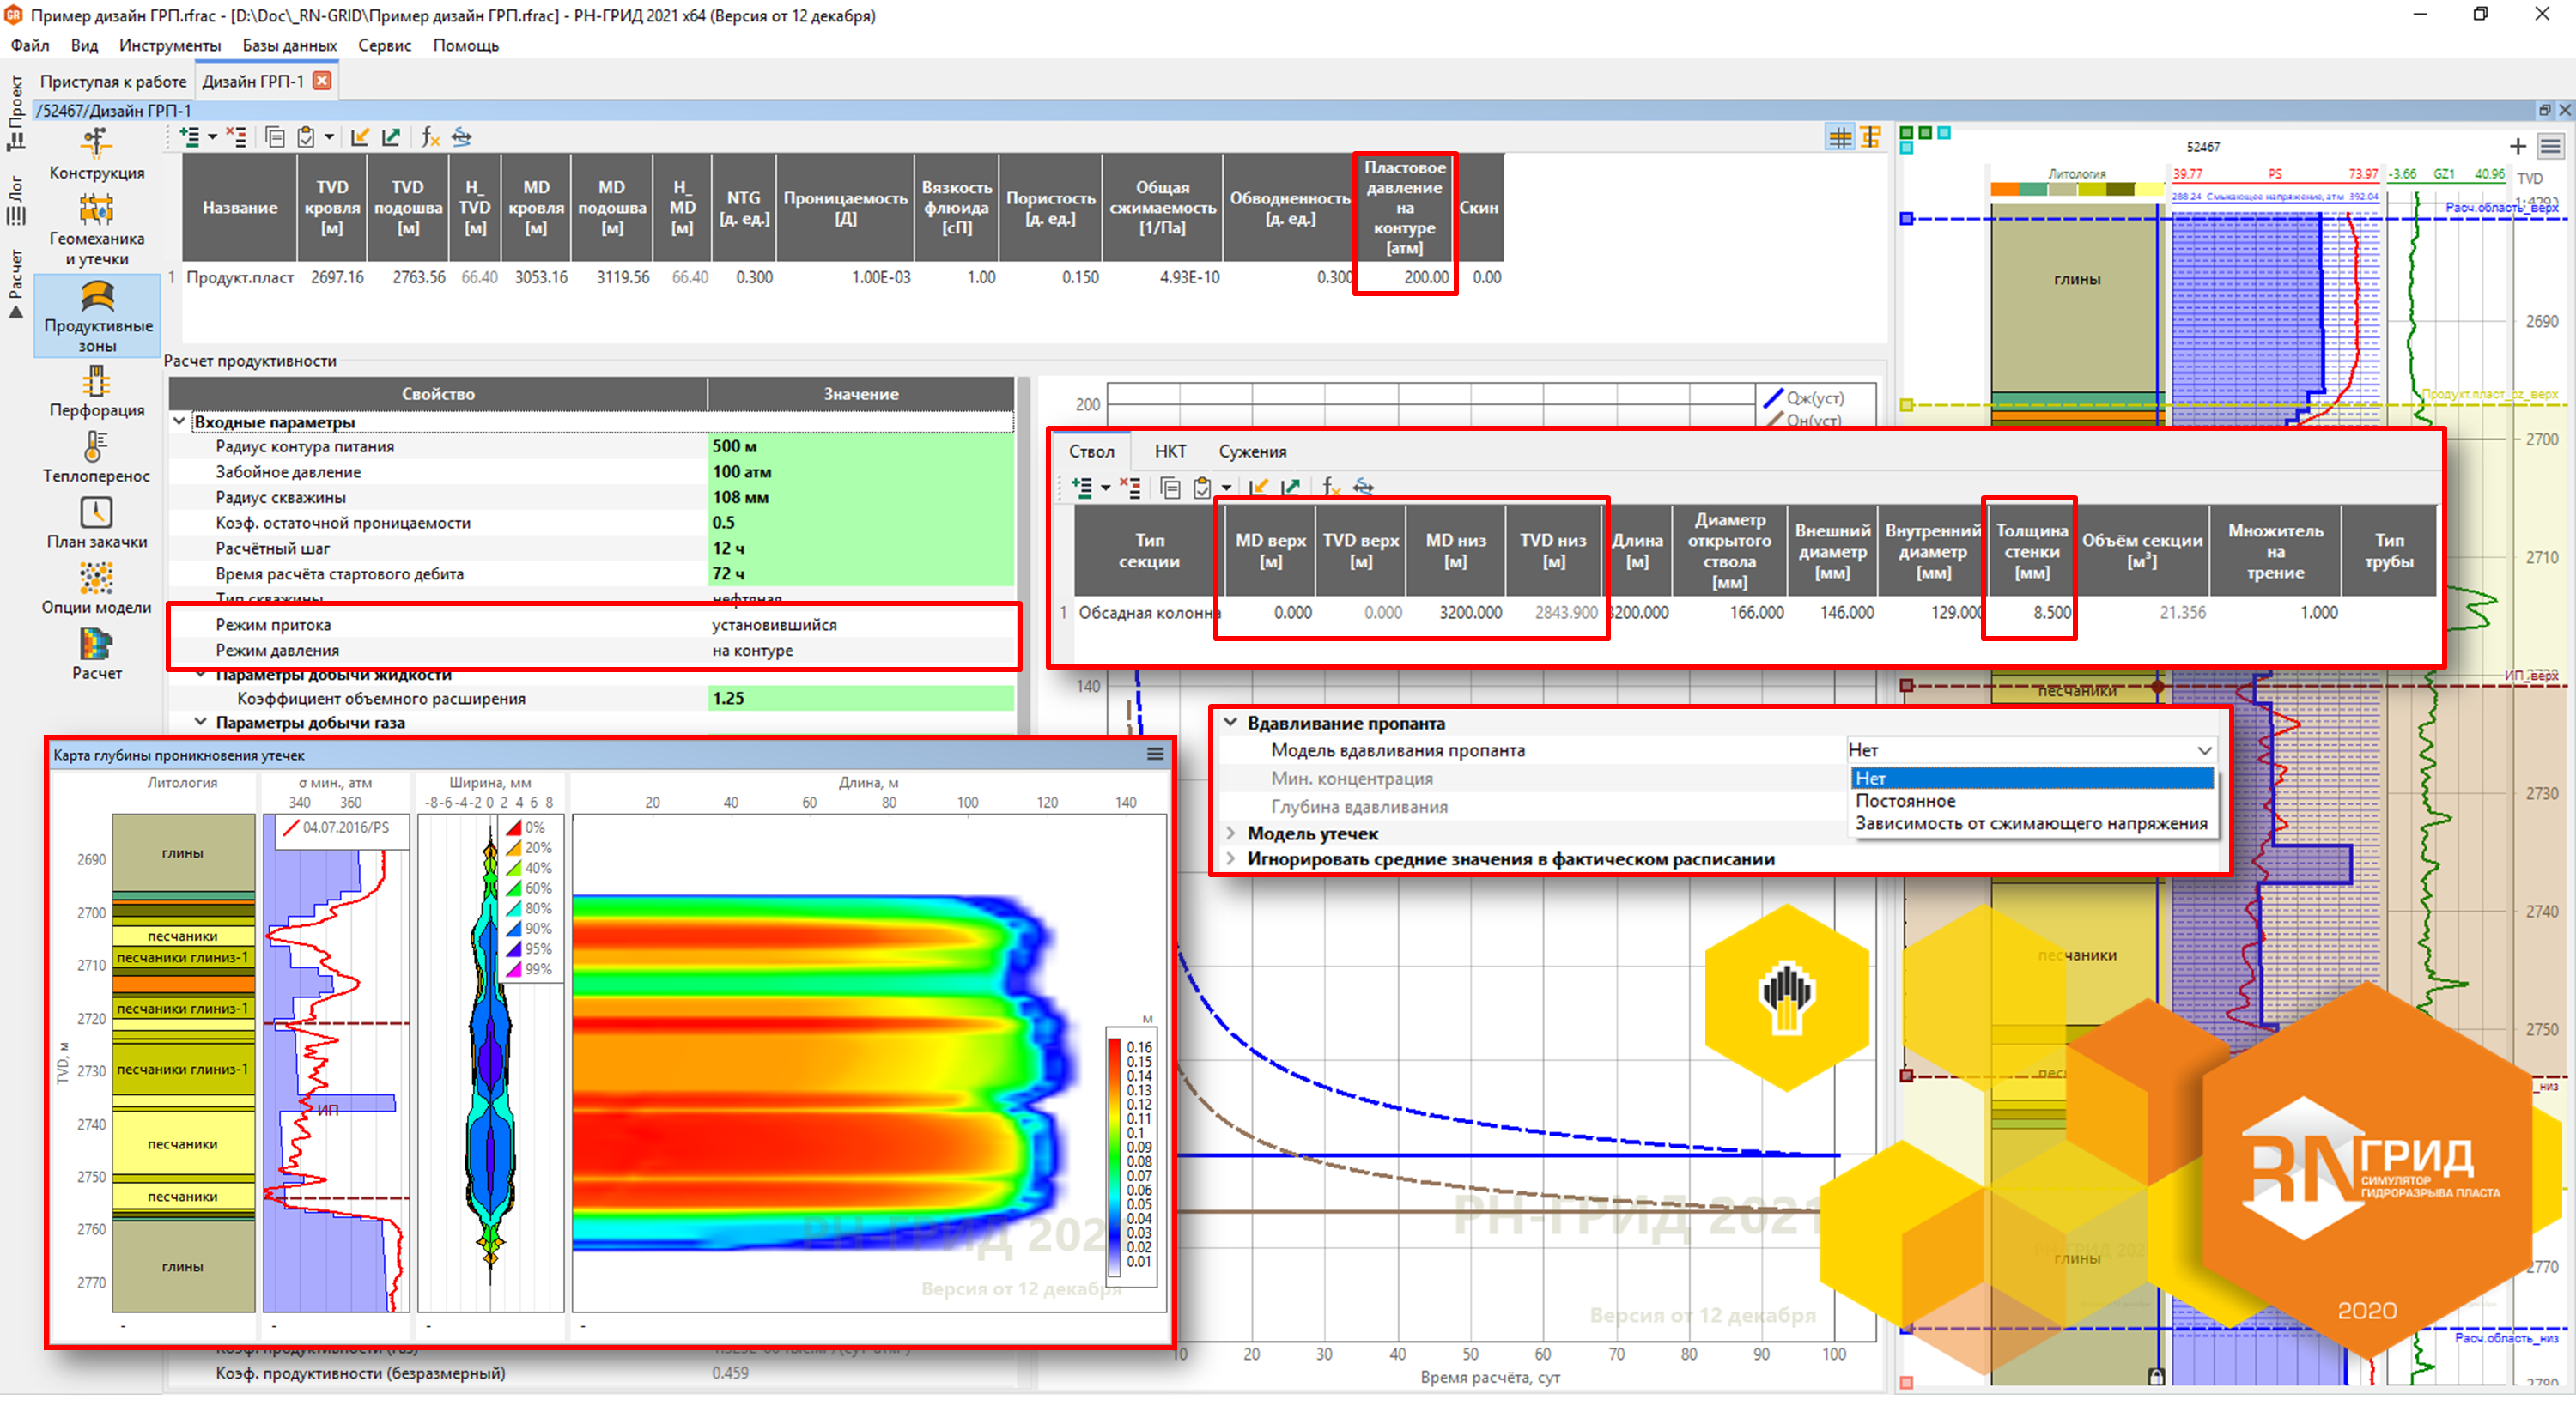
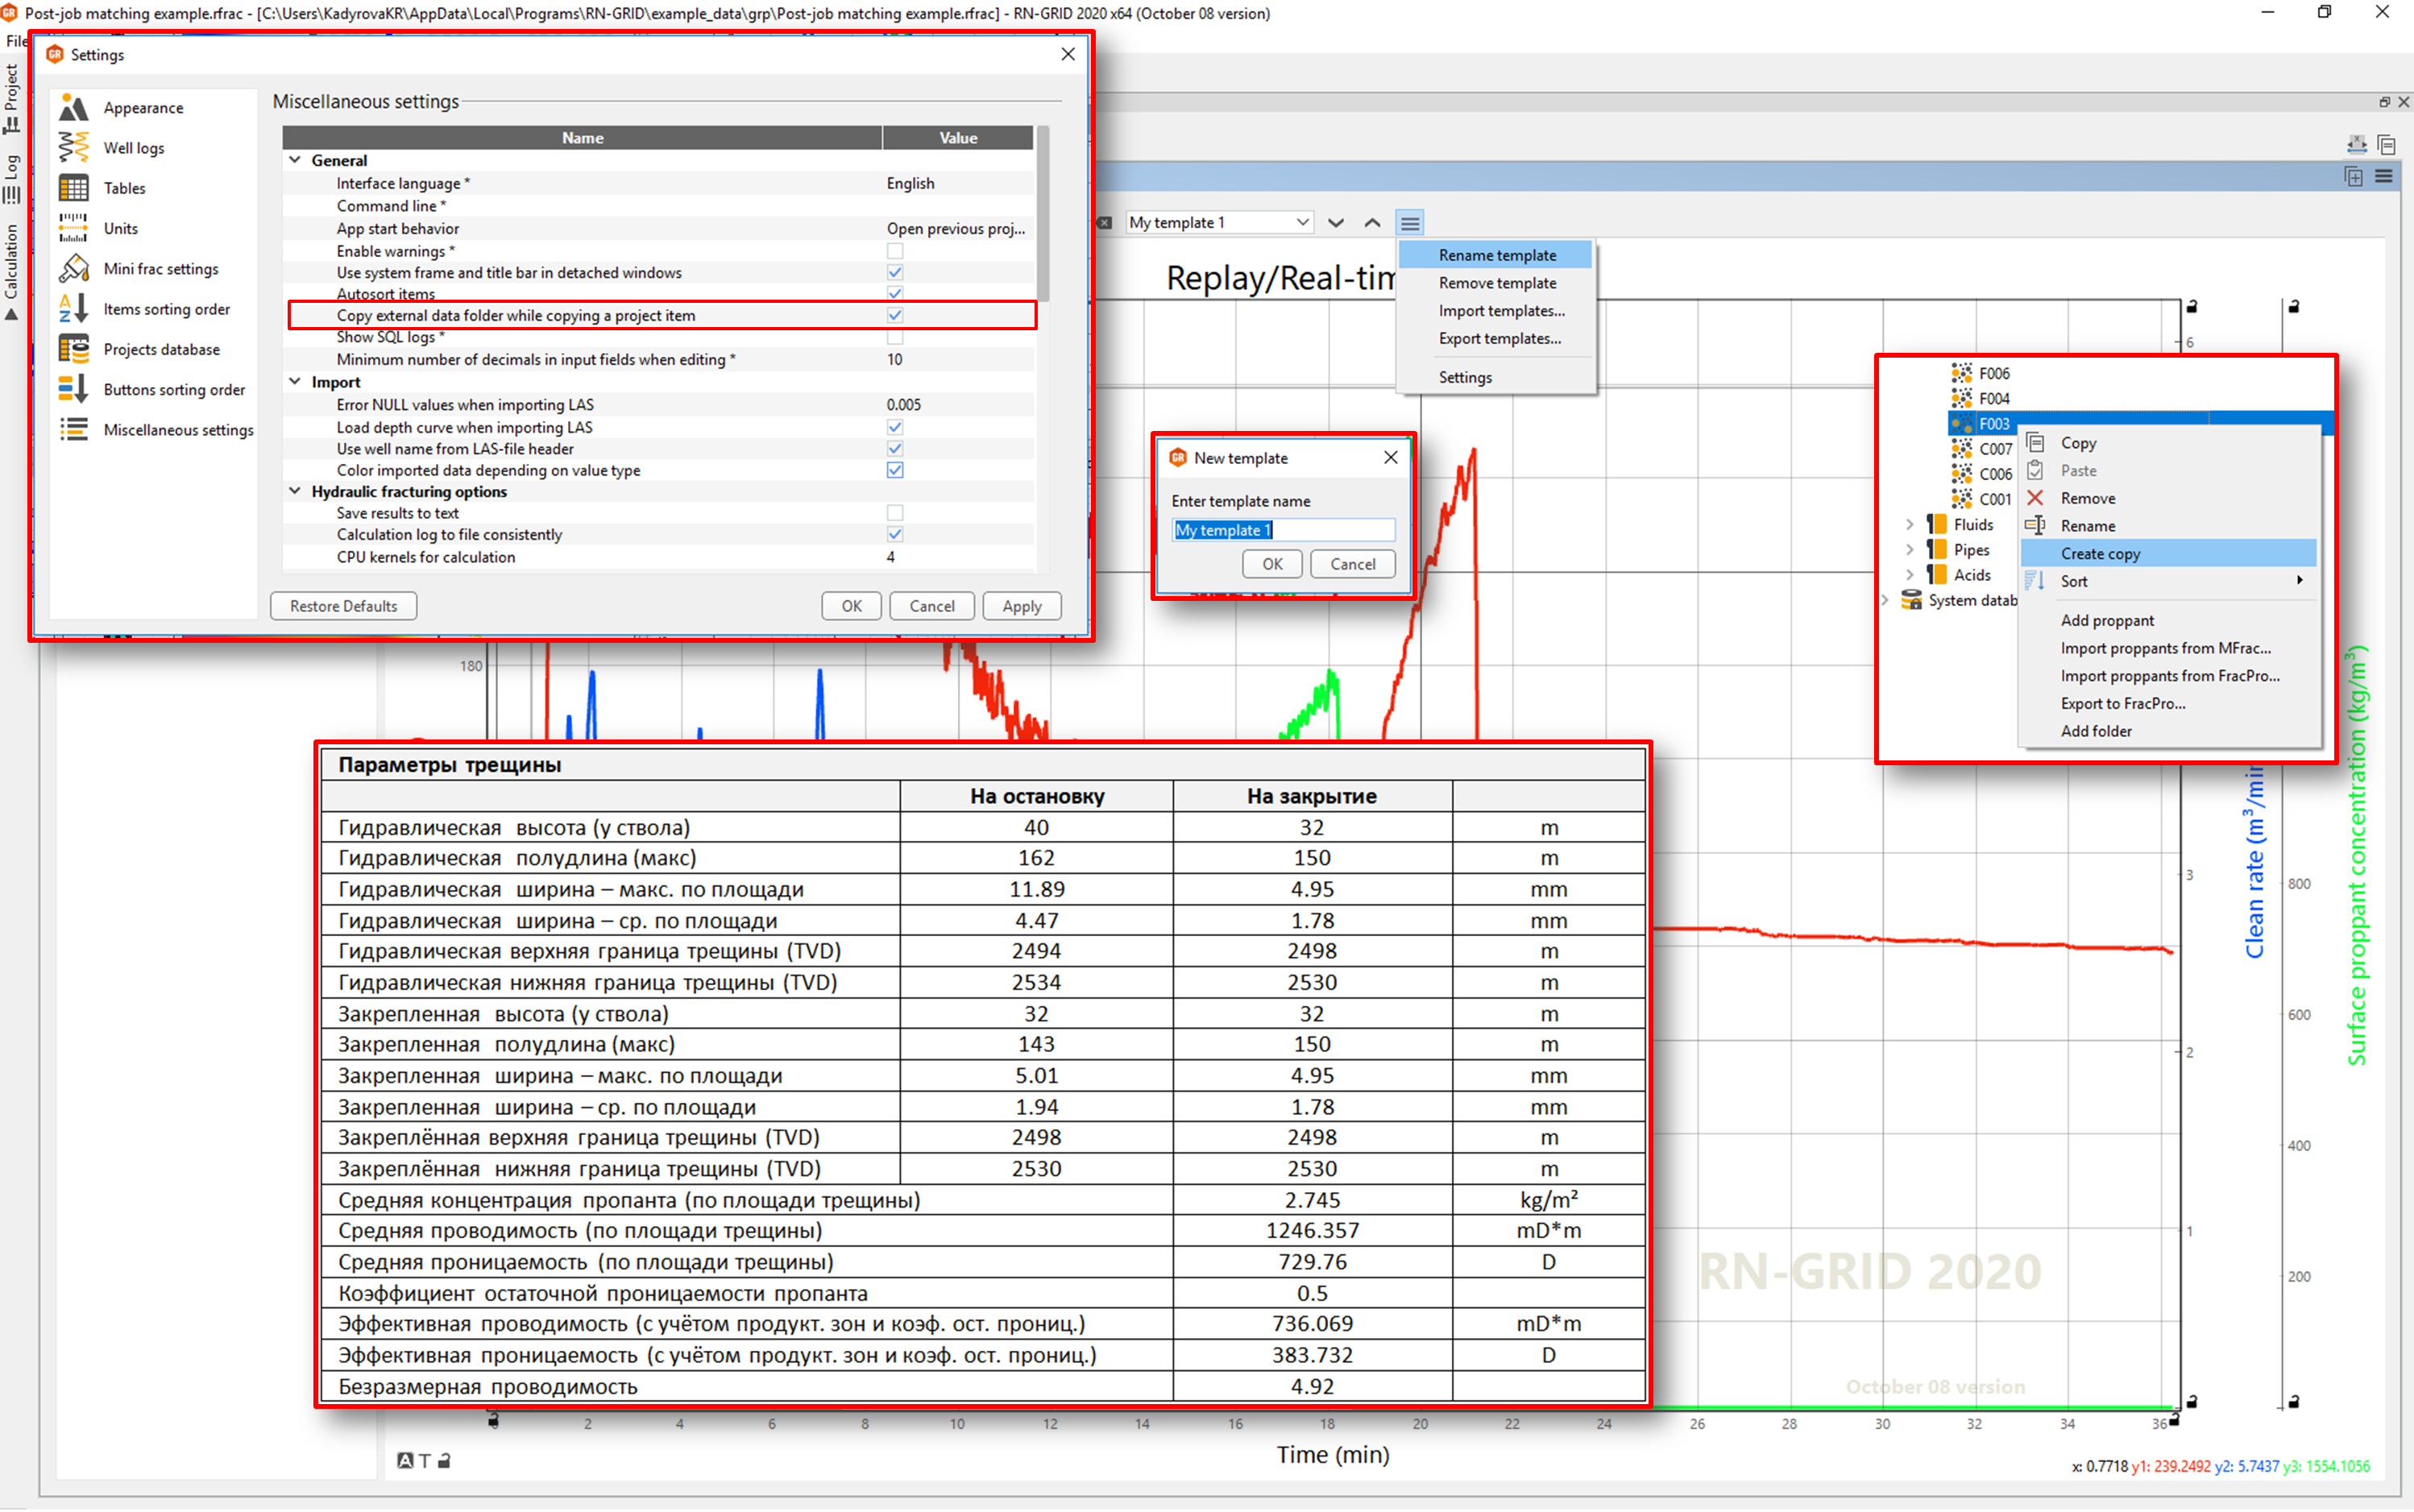
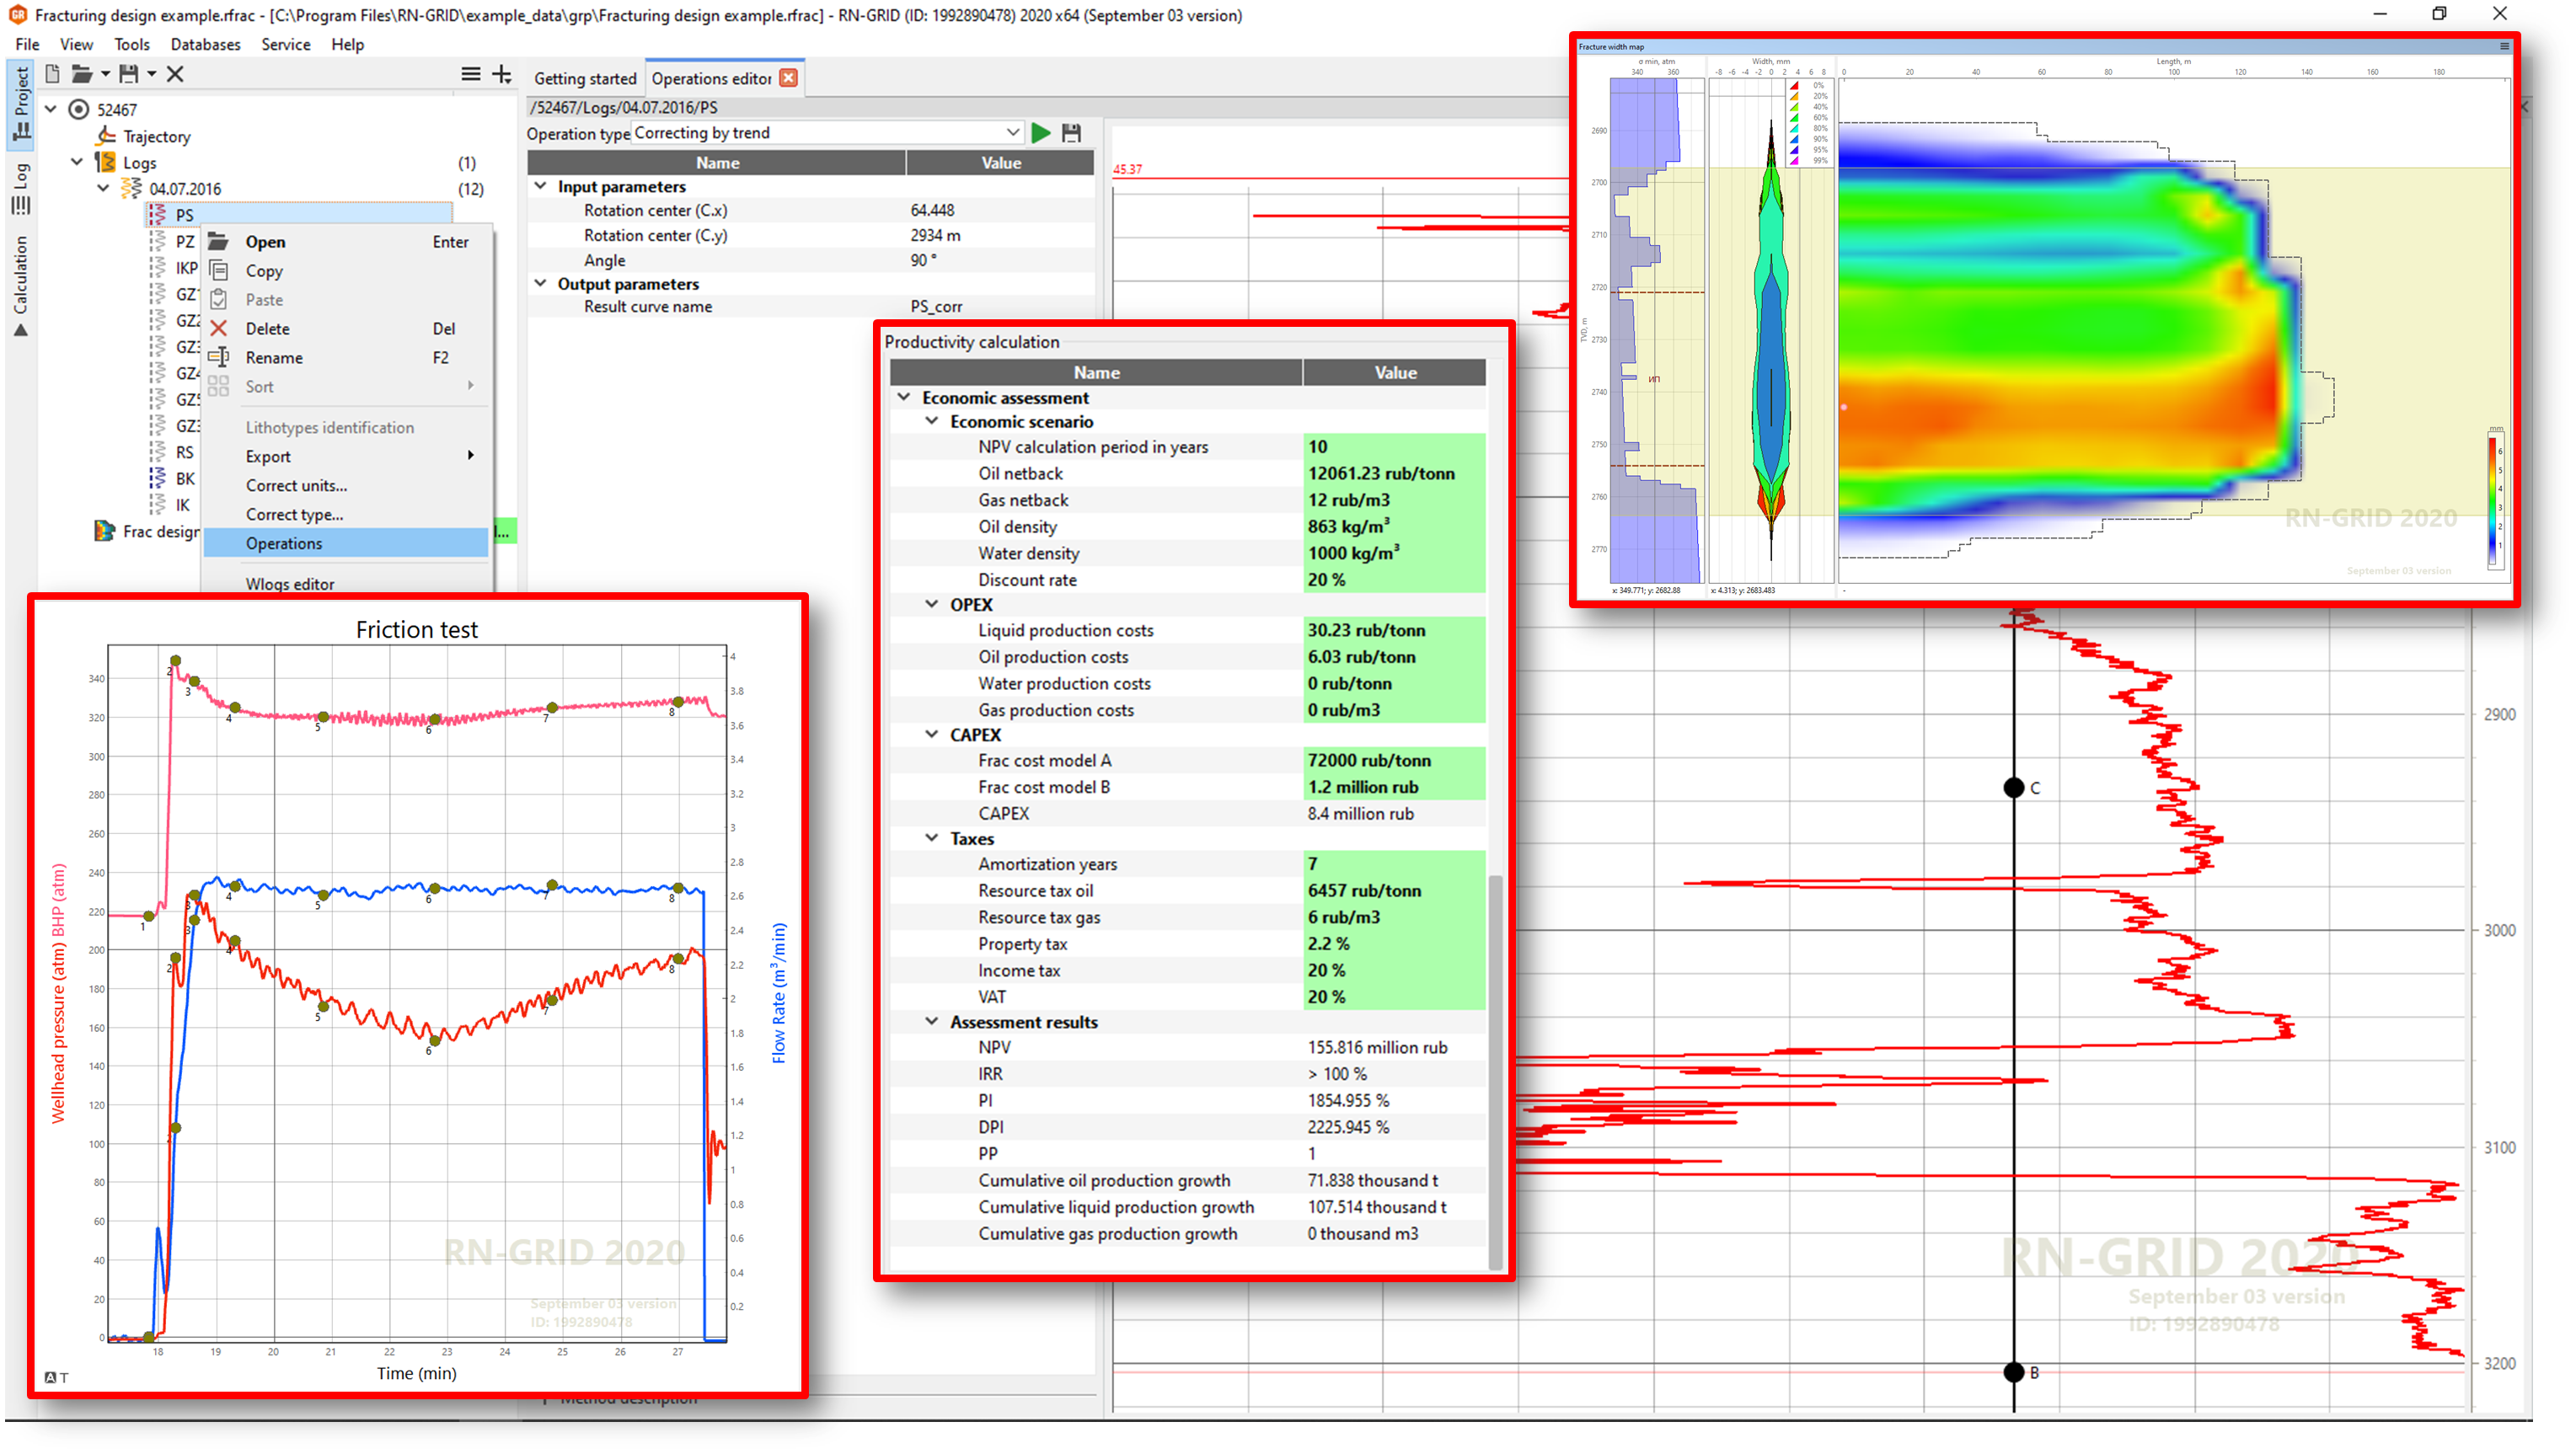
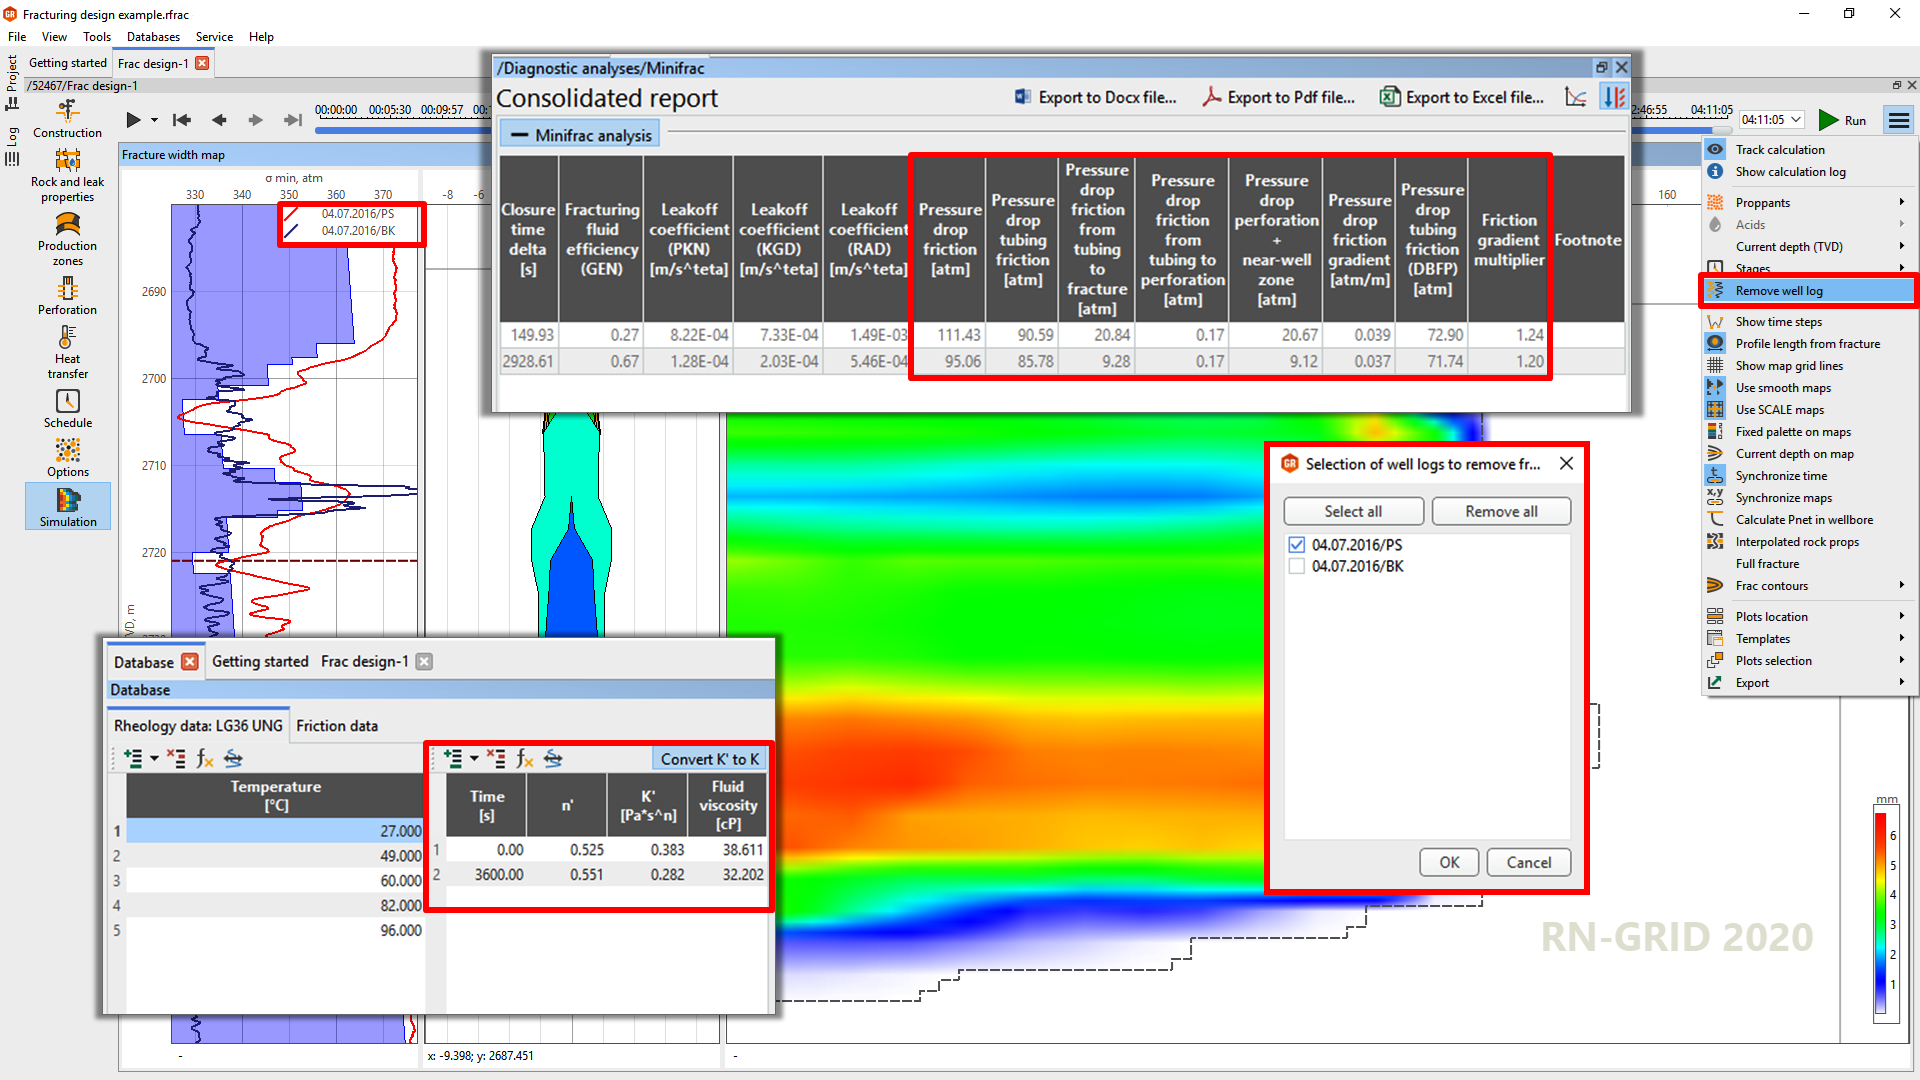
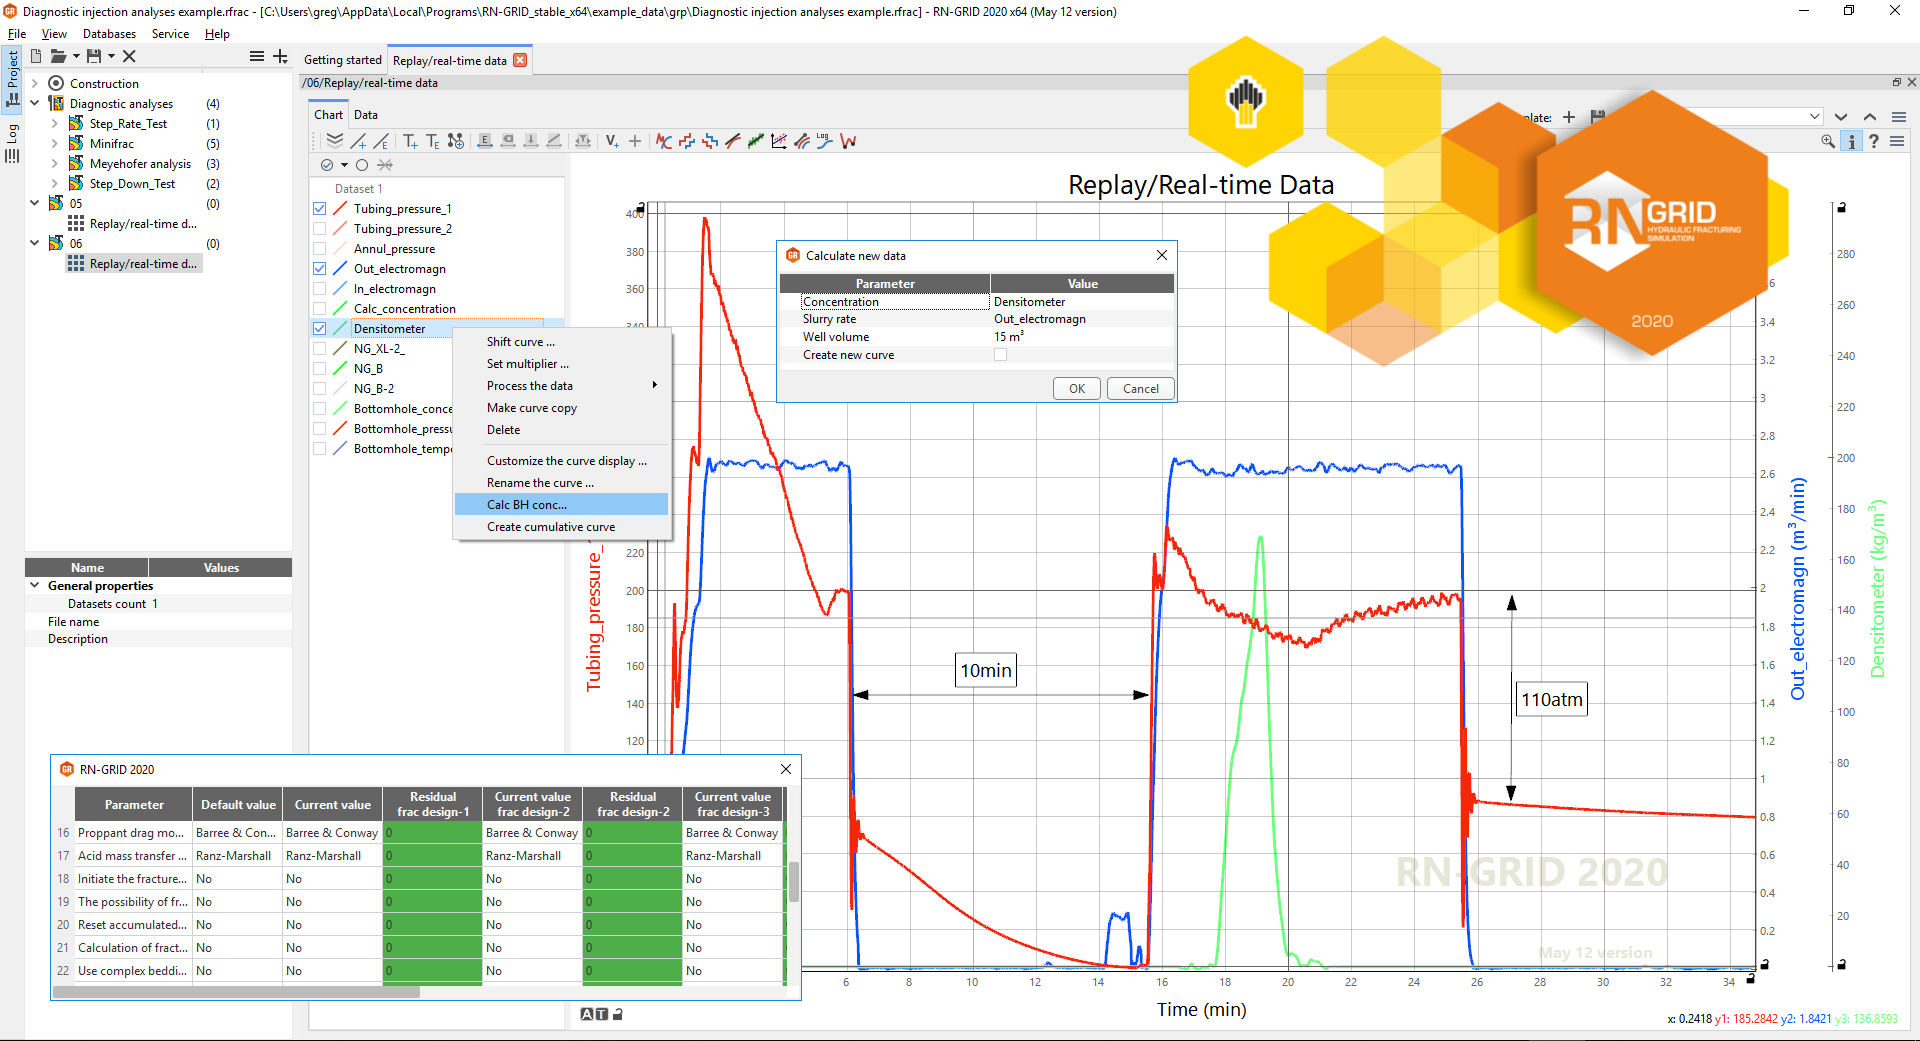
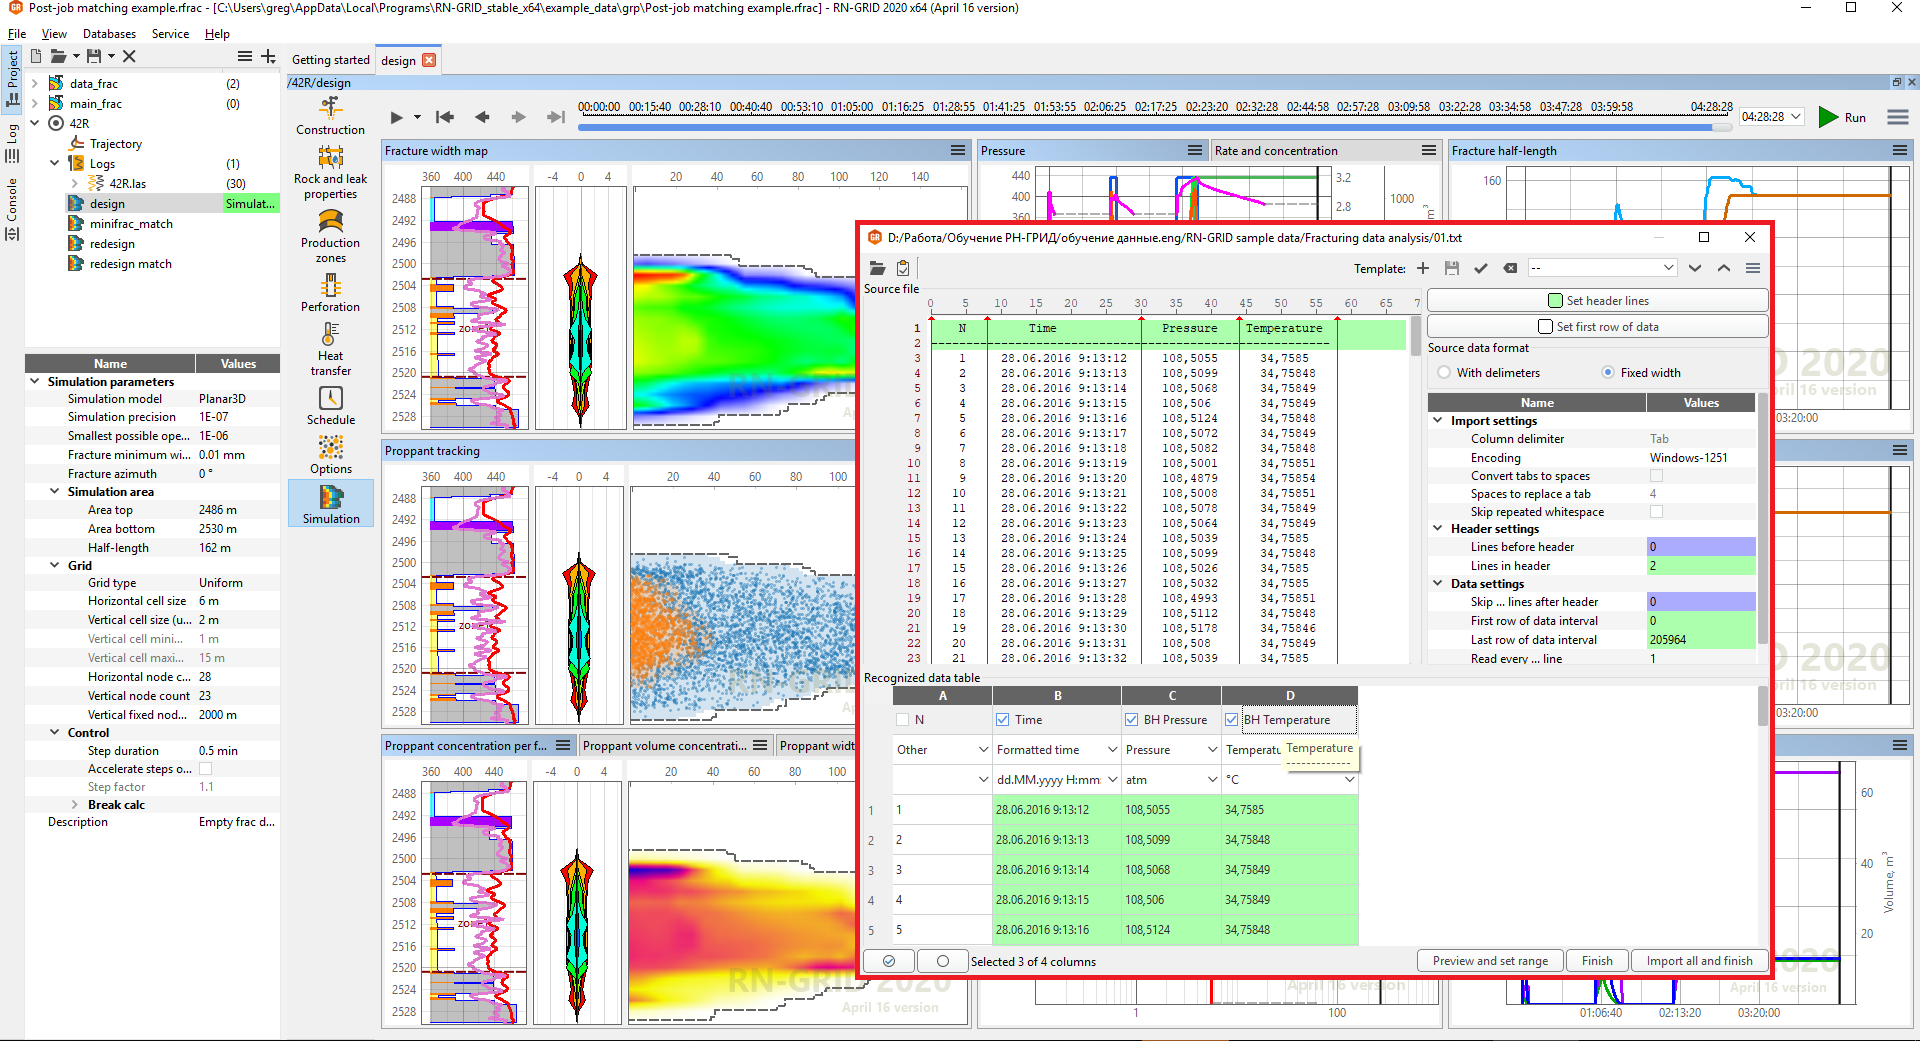
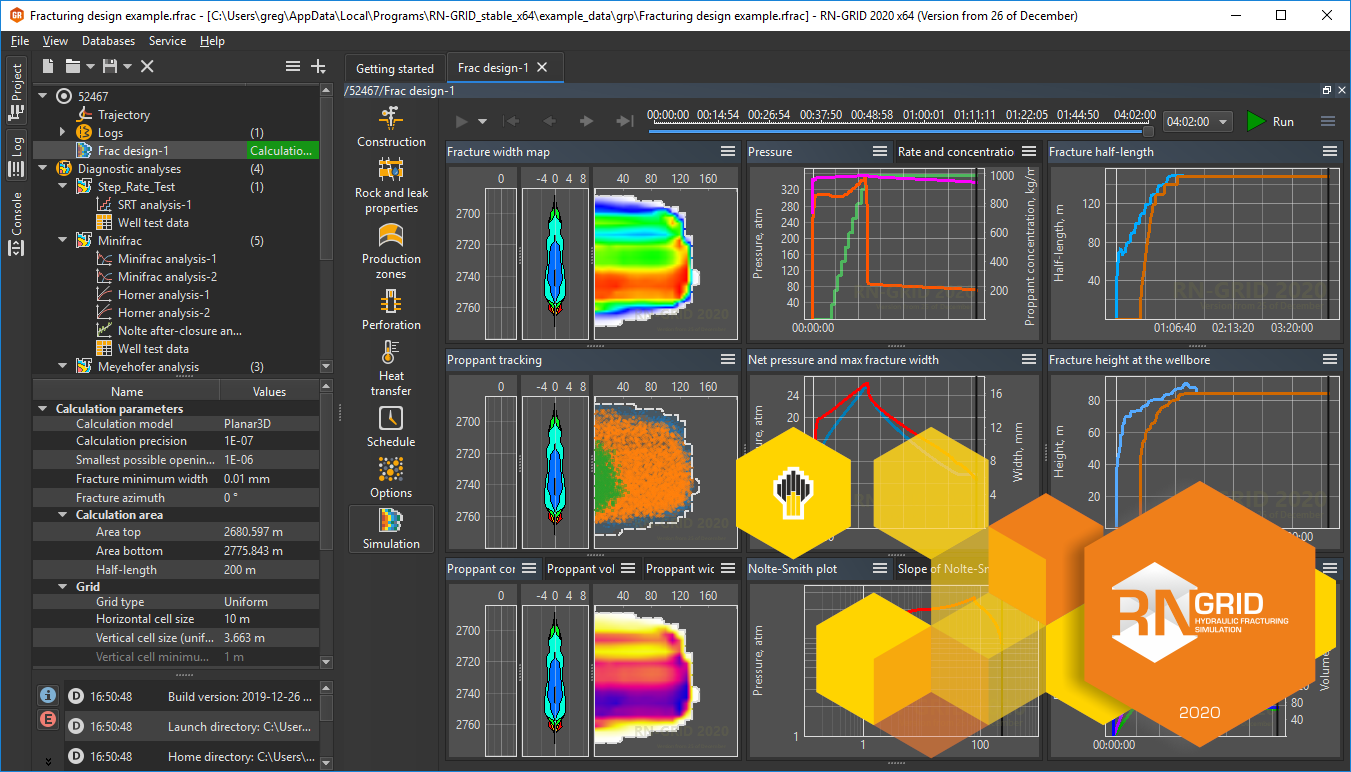
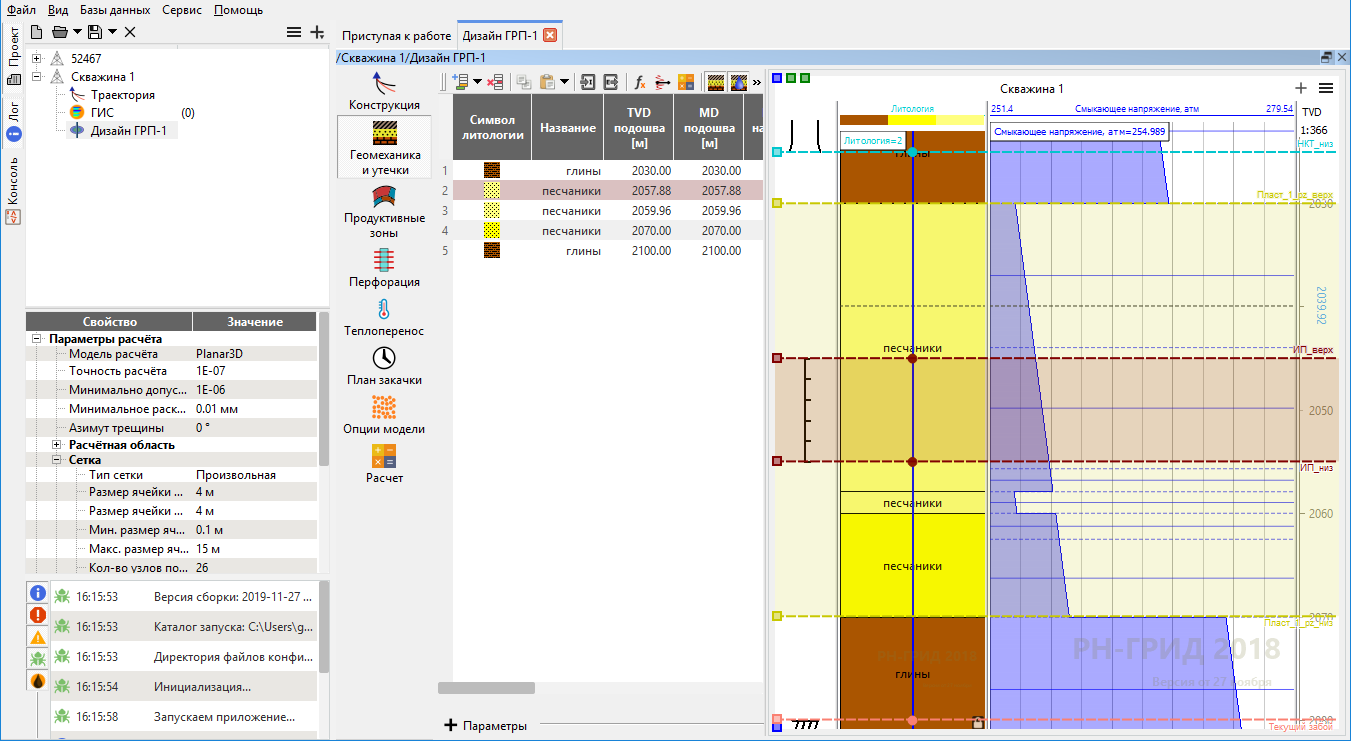
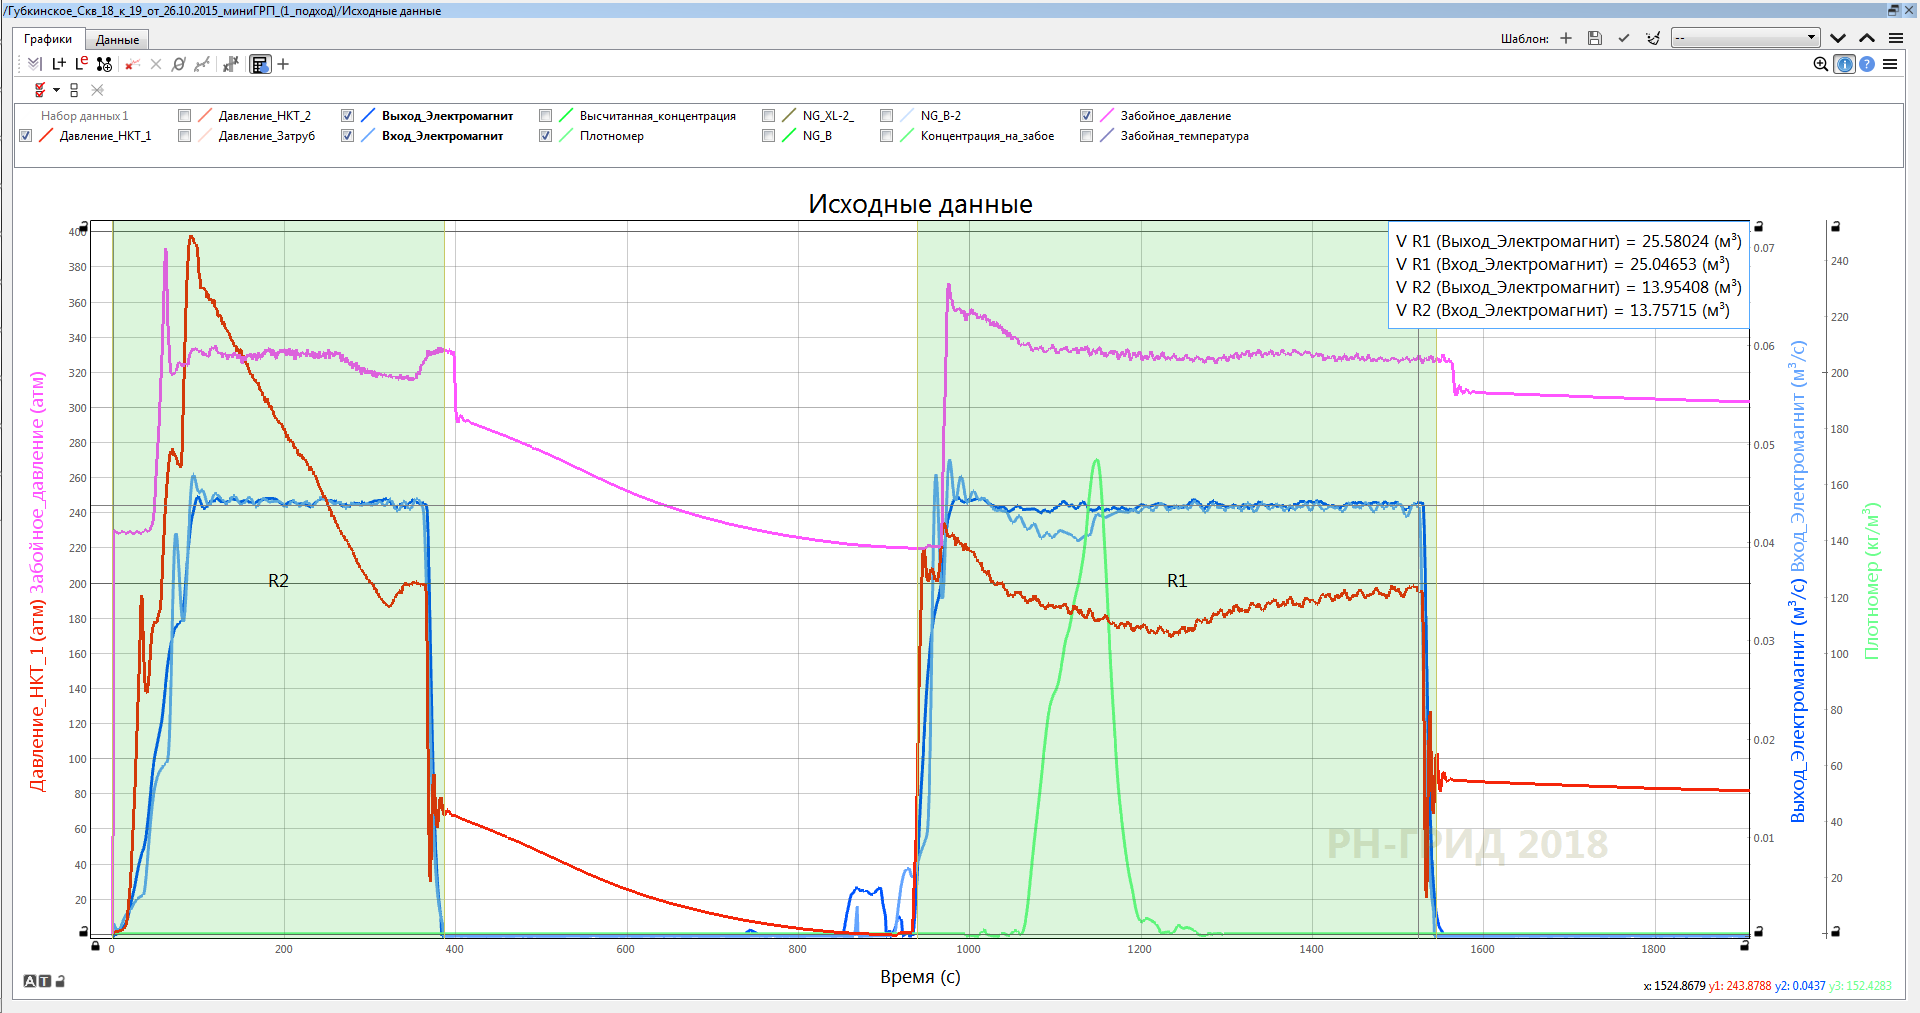
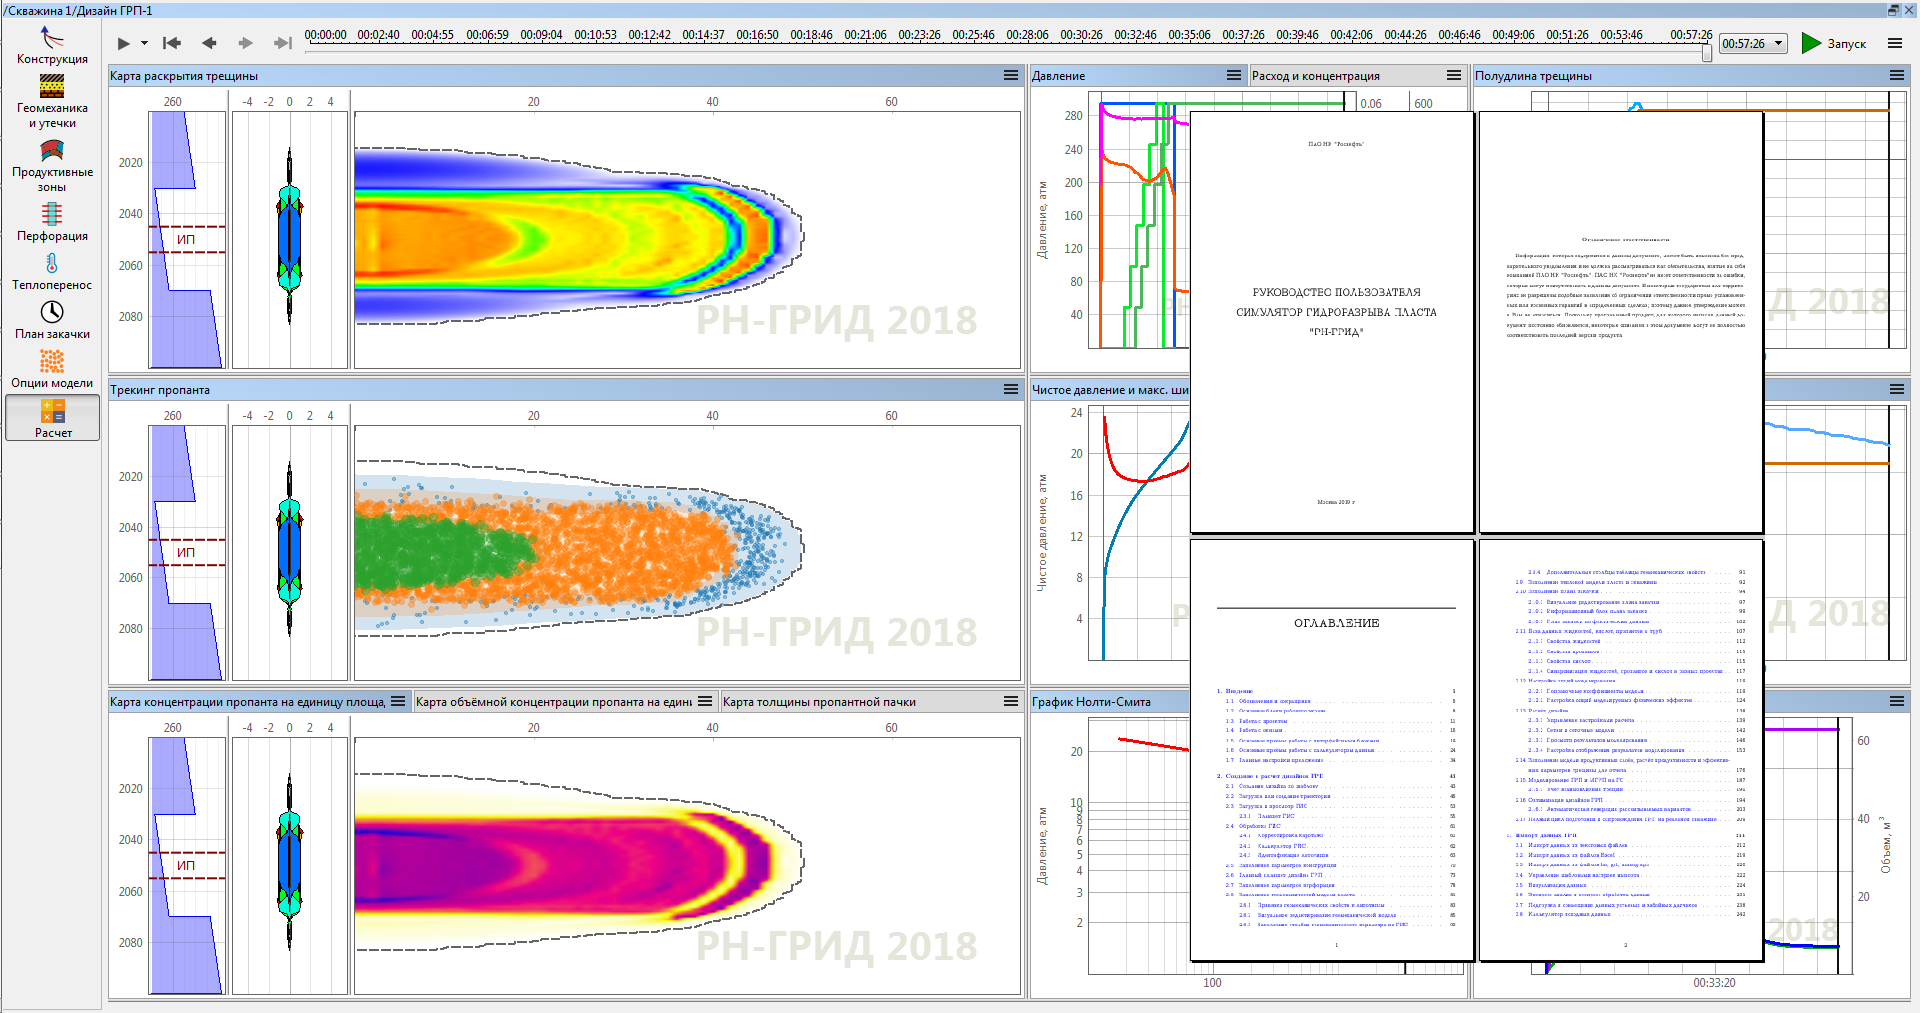
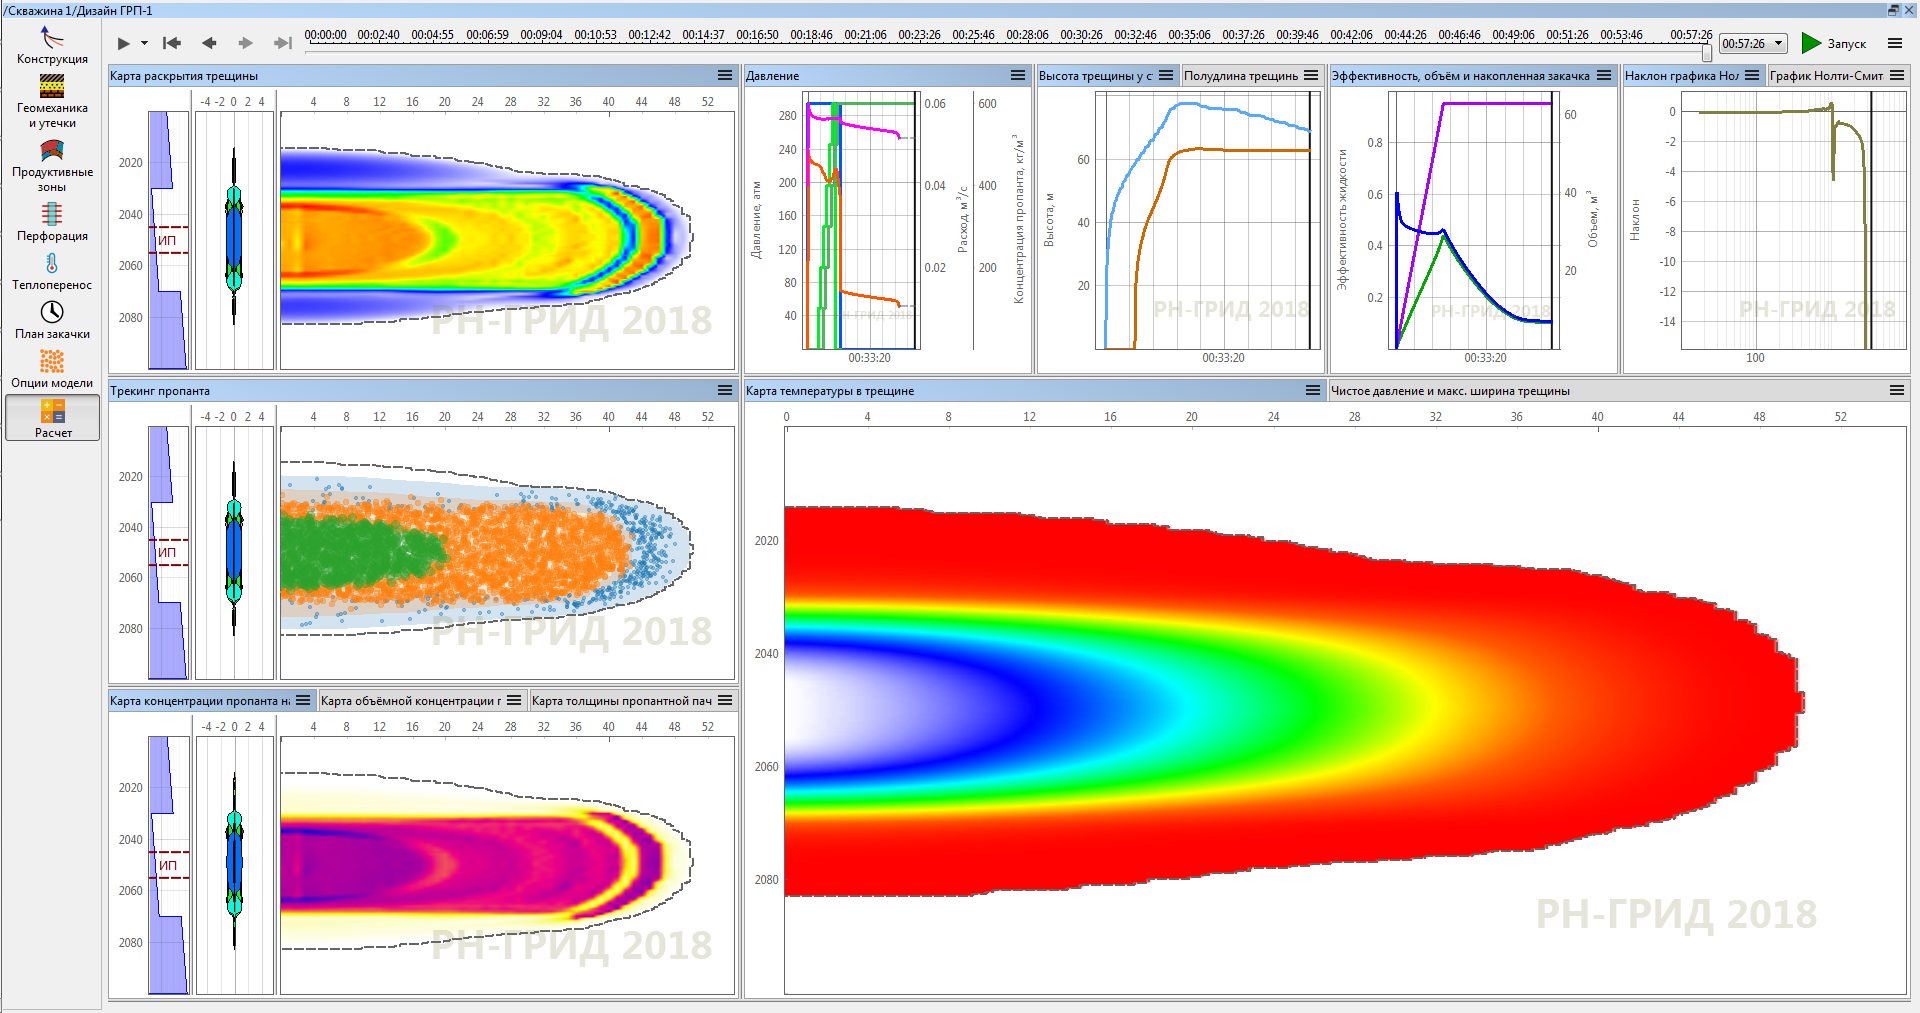
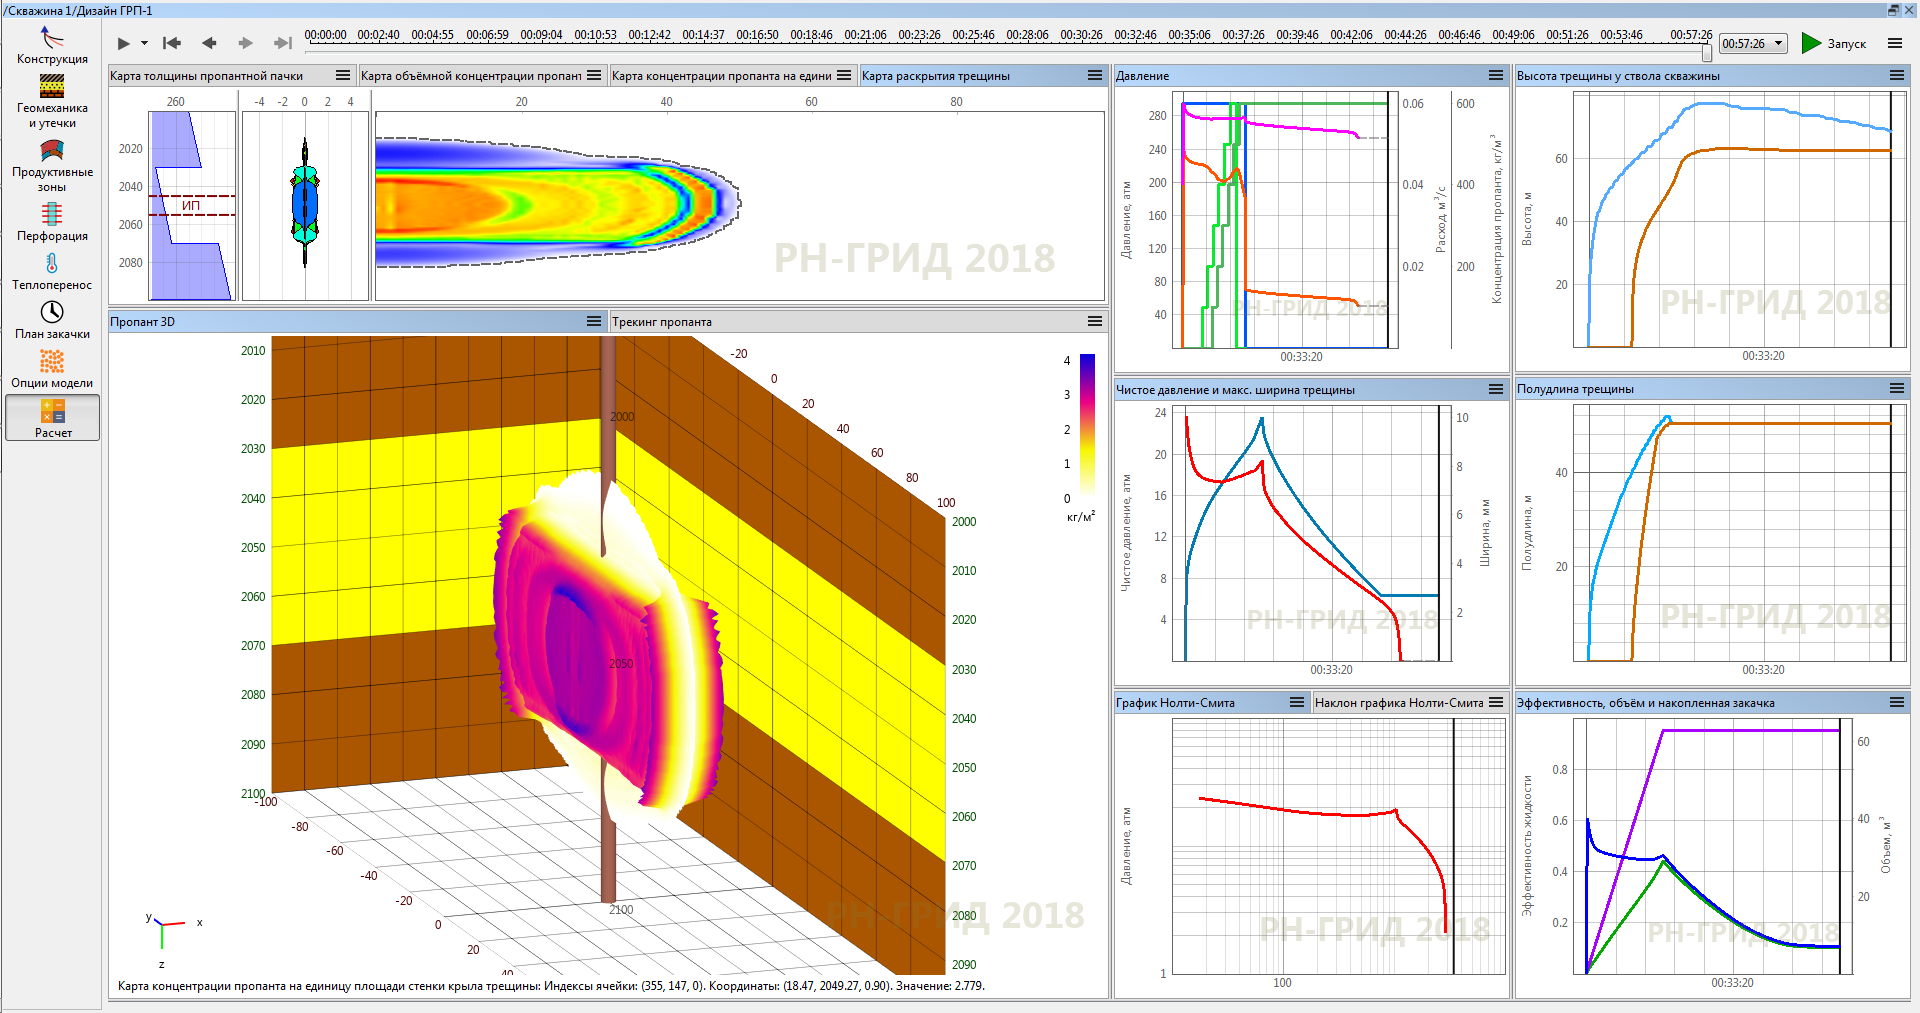
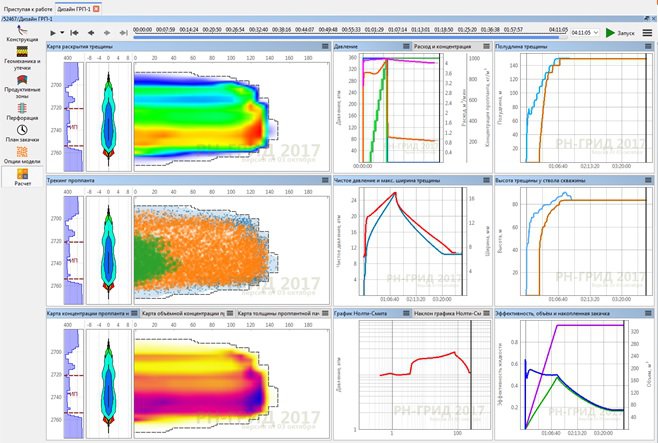
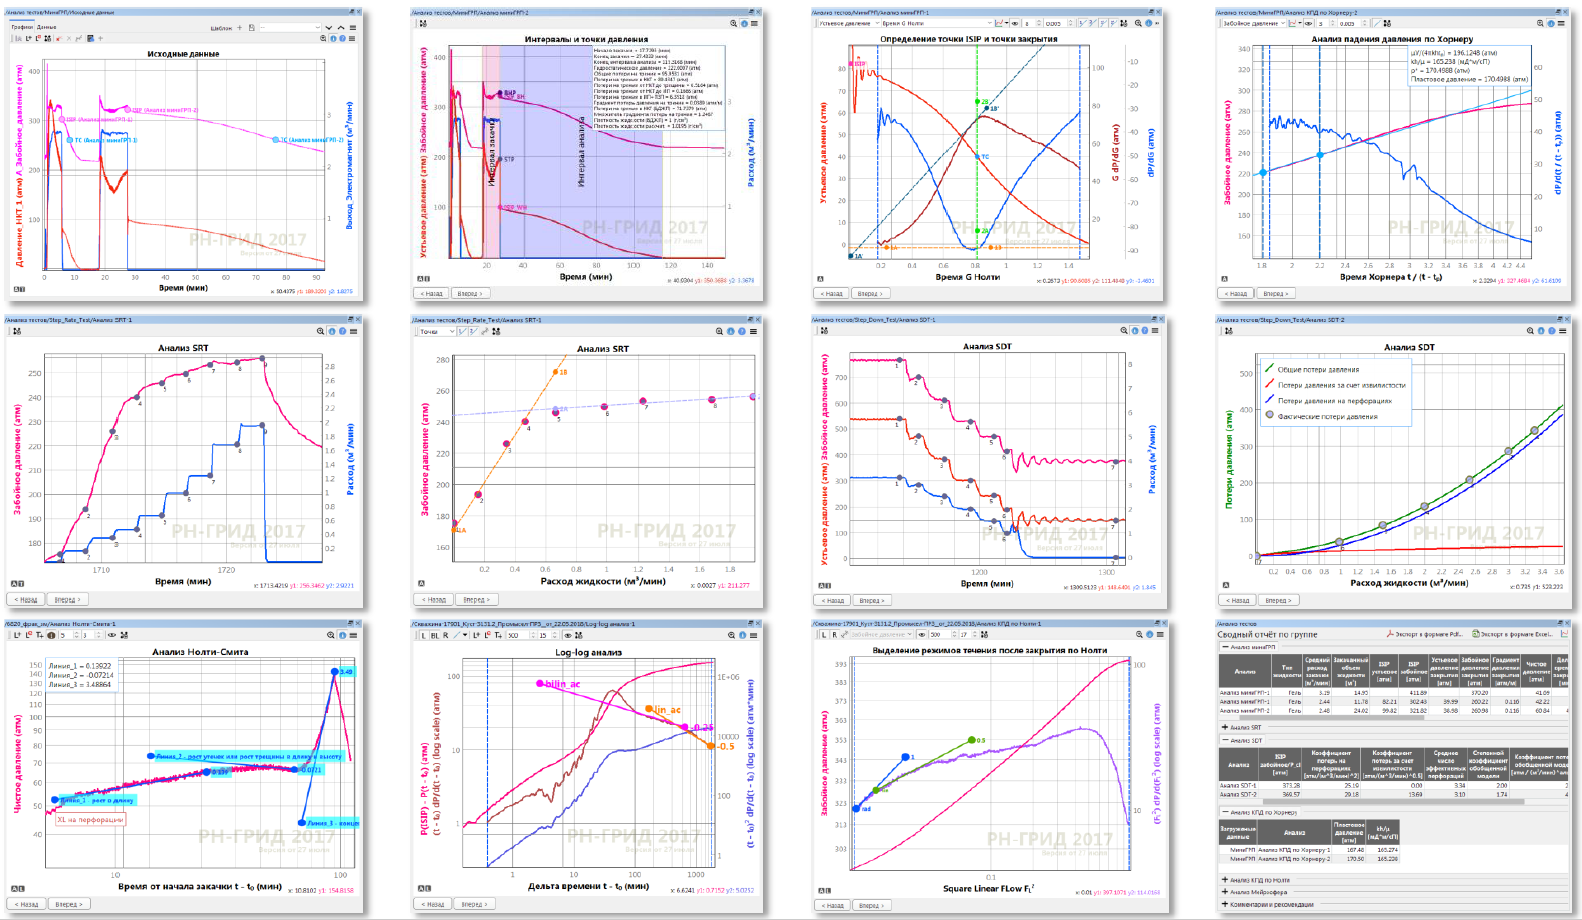
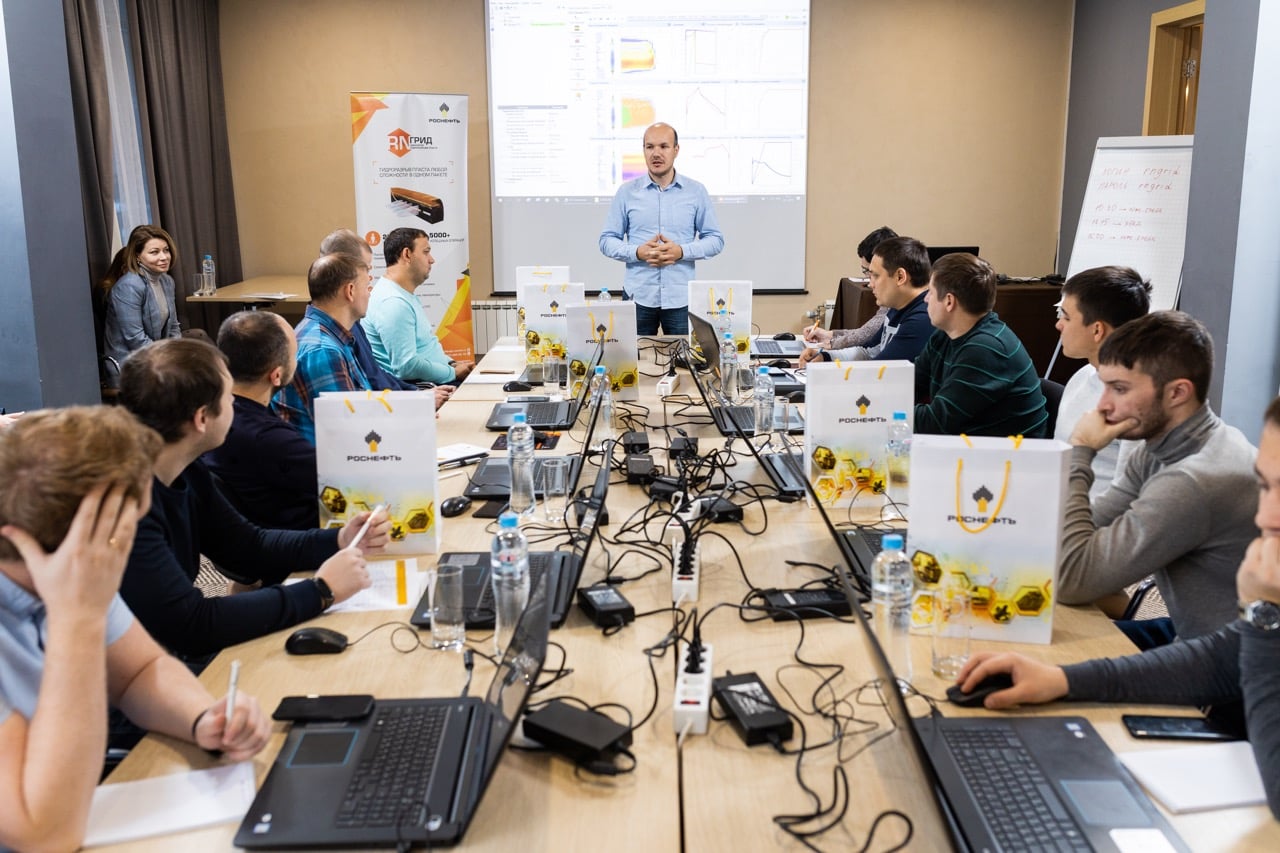
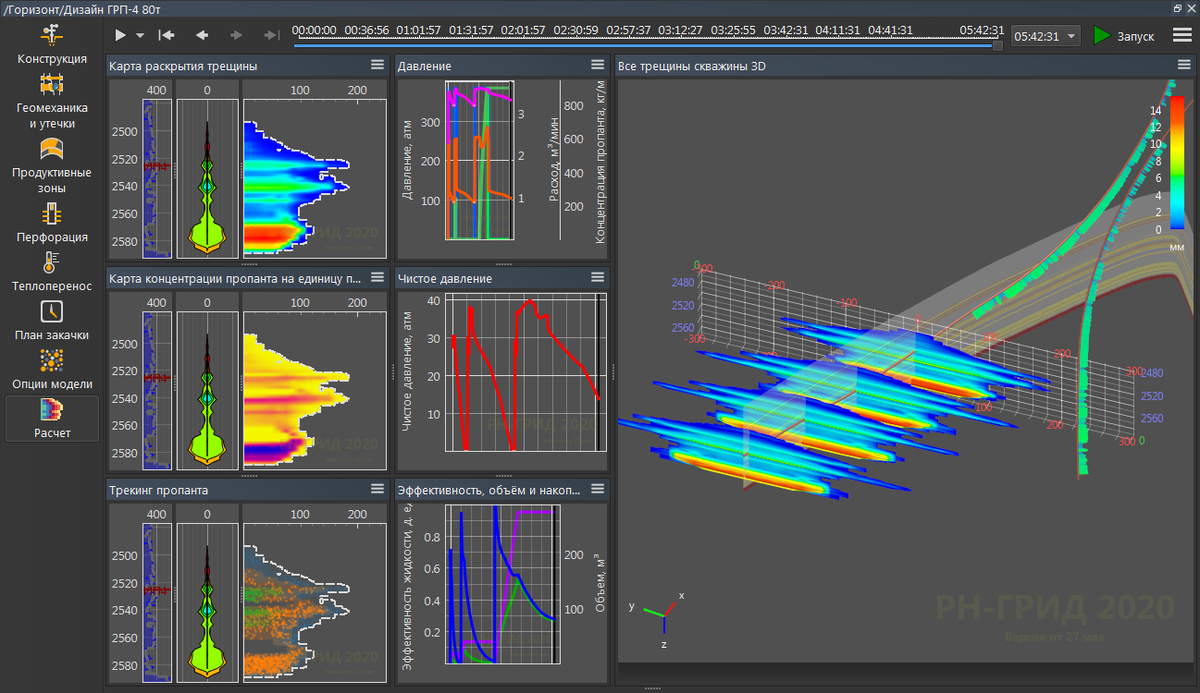
Due to the complexity of physical phenomena and lack of direct observation of the hydraulic fracture development process, a specialized software — hydraulic fracturing simulator — is used to simulate and estimate the technological parameters and the geometry of the fracture during hydraulic fracturing.